Pronóstico semanal de Forex y análisis de FX 05 - 09 De Abril

EUR/USD
The euro continues to form a downtrend against the US dollar. If we consider the trades of the past week, then we can clearly see the divergence between the price and the oscillator. We see a section of the market where the price falls, but the oscillator looks up. Partially the same can be said about the histogram, which also started to grow and is already in the area above 0. The level 1.1757 should be highlighted, which is very important for the current stage and now it is being tested for the second time in the form of a test. Most likely, the price moves up from this level, and after that it will again return to its main downward movement.

GBP/USD
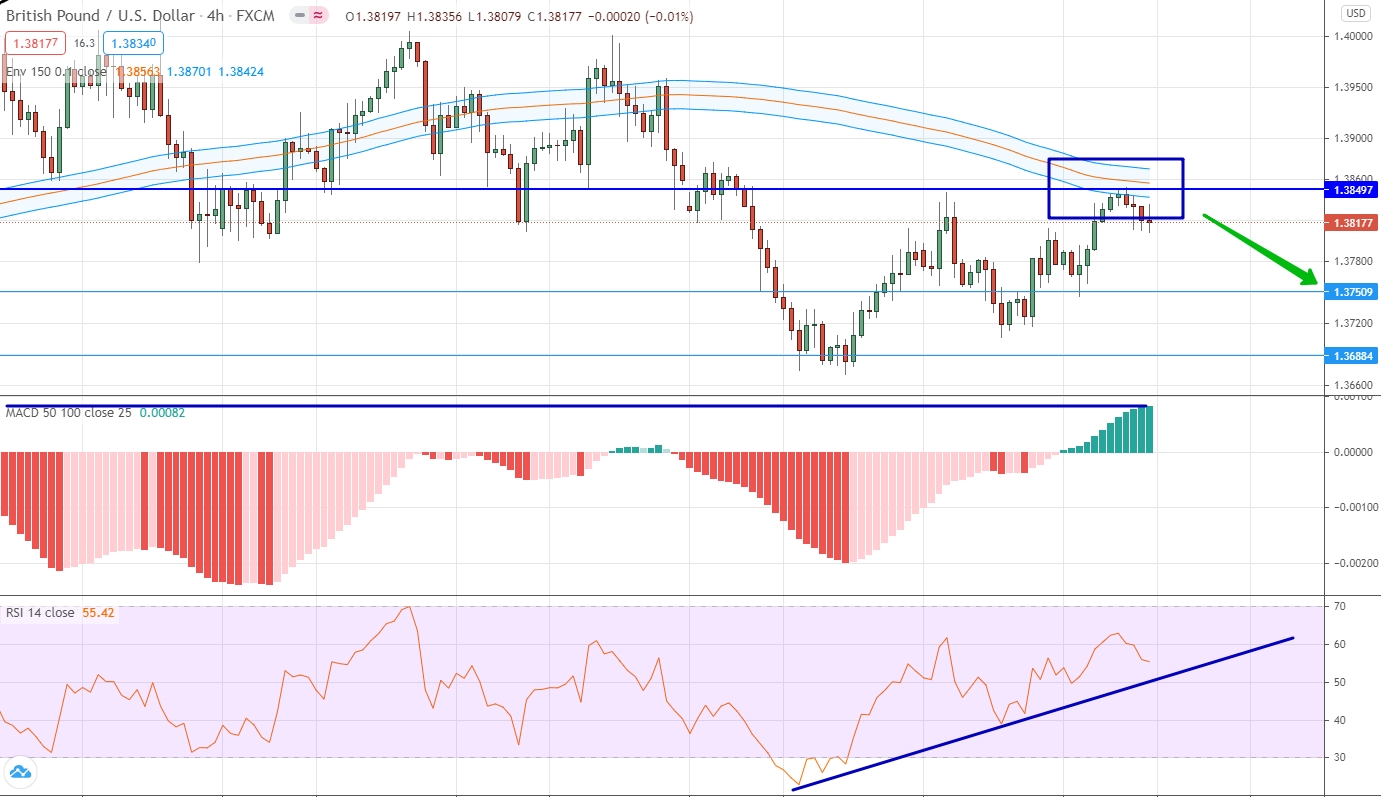
The last week of trading for the British pound against the US dollar was characterized by an upward movement. It is very important to note that the end of last week's trading created a turning point, when the price simultaneously reached the level of moving averages and the very important level of 1.3850. The oscillator still looks up, and the histogram is at its maximum values for more than 2 months. We expect that in the area of the moving averages the price will find very strong resistance, which will force it to make a downward movement, which means that you can open a contract for a fall.
USD/JPY
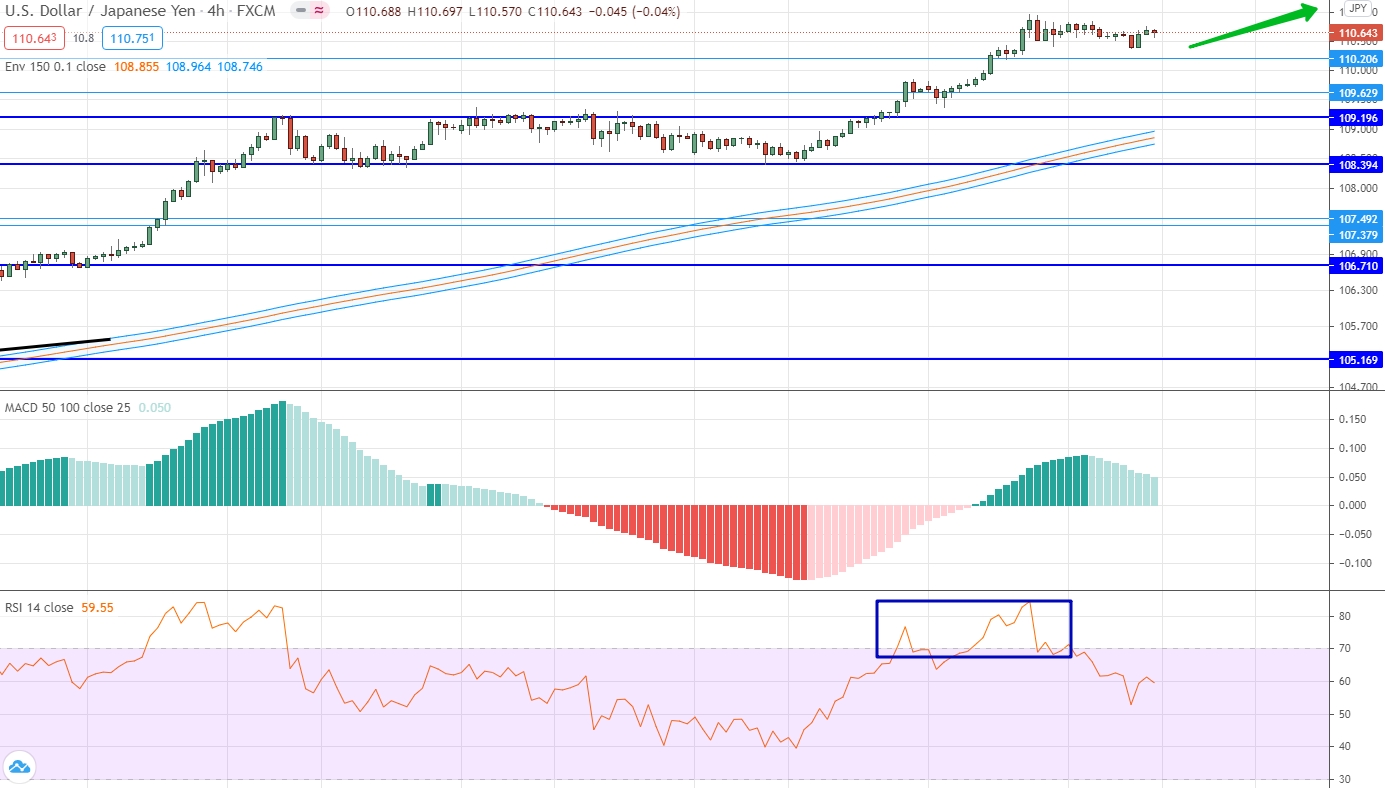
The US dollar continues to develop an uptrend against the Japanese yen. The upward movement turns out to be quite strong, and this is very clearly seen from the oscillator, which has been in the overbought area for a long time, but has now entered neutral positions. If we consider exclusively the price chart, then it is very important to note the absence of volatility, but at the same time, a progressive upward movement certainly occurs. We expect that the upward dynamics will continue to develop, which means that an upward contract can be opened.
AUD/USD
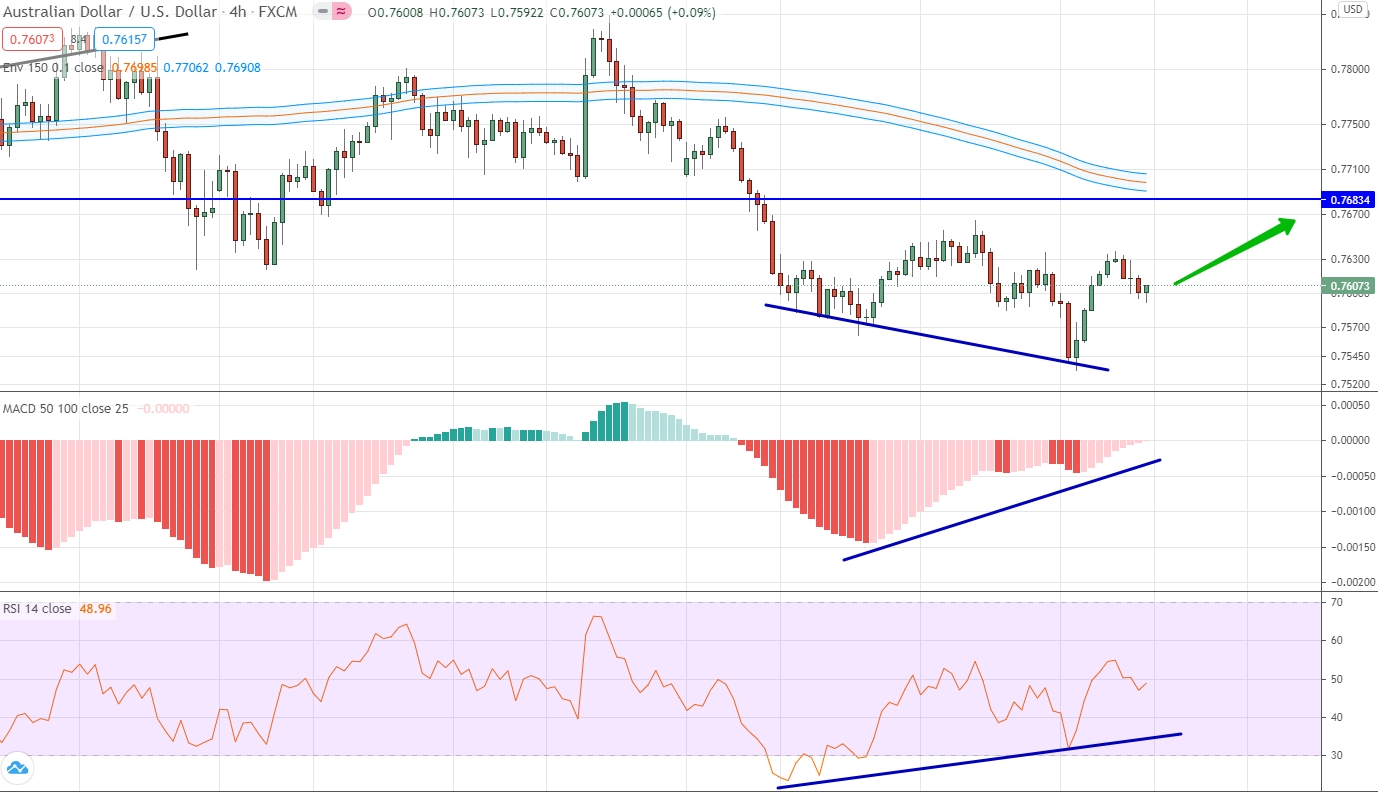
The Australian dollar is trying to form a downward movement against the US dollar. At the same time, it is very important to note that for a long time a global upward trend dominated for the currency pair, and it still affects the price. As for local trading, it is very important to note here that the price is falling and the indicators are looking up. Thus, we are dealing with a typical divergence, which is confirmed by all indicators. Therefore, we can expect that the price will make an upward movement up to the level of 0.7683. You cannot trade upwards beyond this level.
USD/CAD
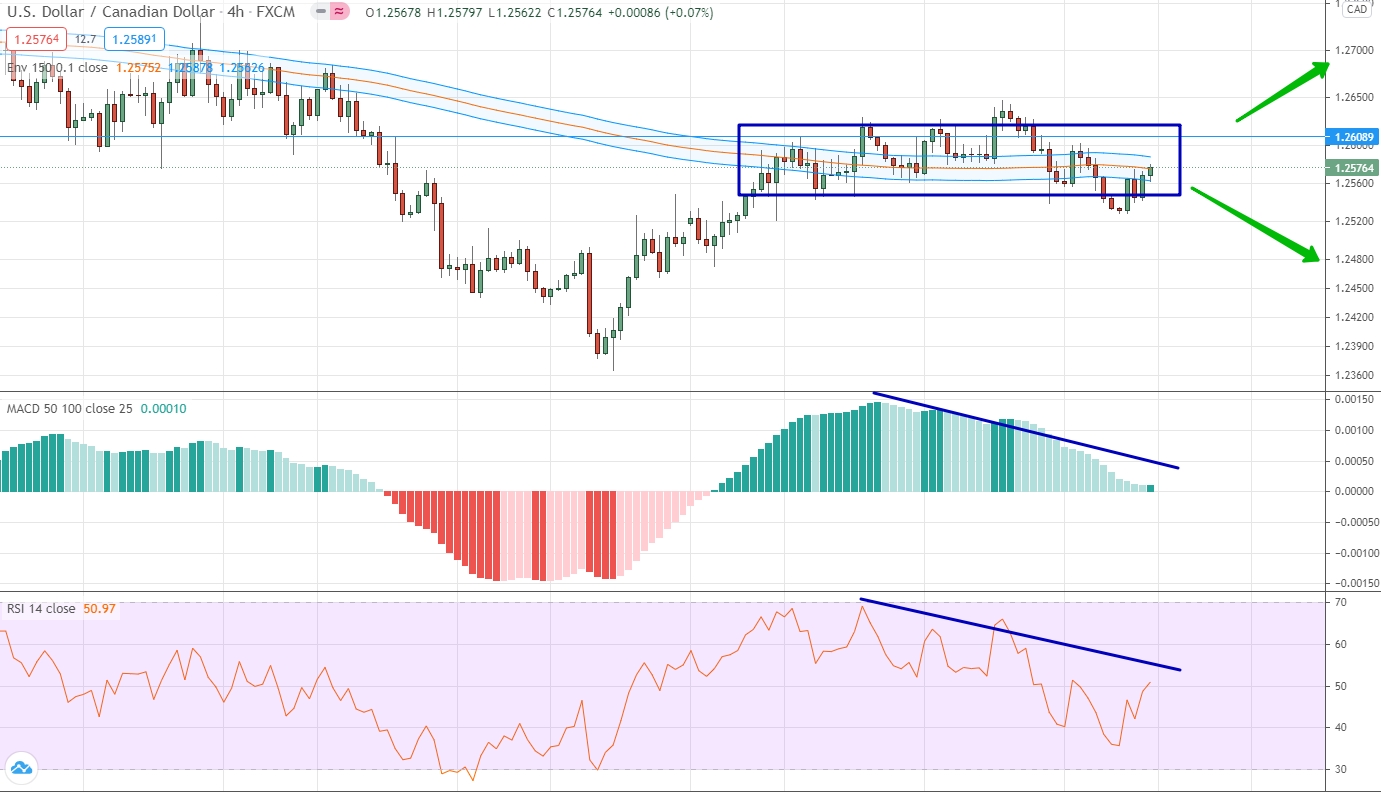
The trading of the last week for the US dollar against the Canadian dollar is characterized by almost no volatility, which is well confirmed by the price movement only near the level of the moving averages and near the important price level of 1.2609. Please note that the movement is horizontal, but the indicator is looking down. Thus, the downward dynamics indicates its strength, and it is visible on the global movement. Thus, you can trade short. An upward contract will only be possible if the price consolidates above 1.2609.
USD/CHF
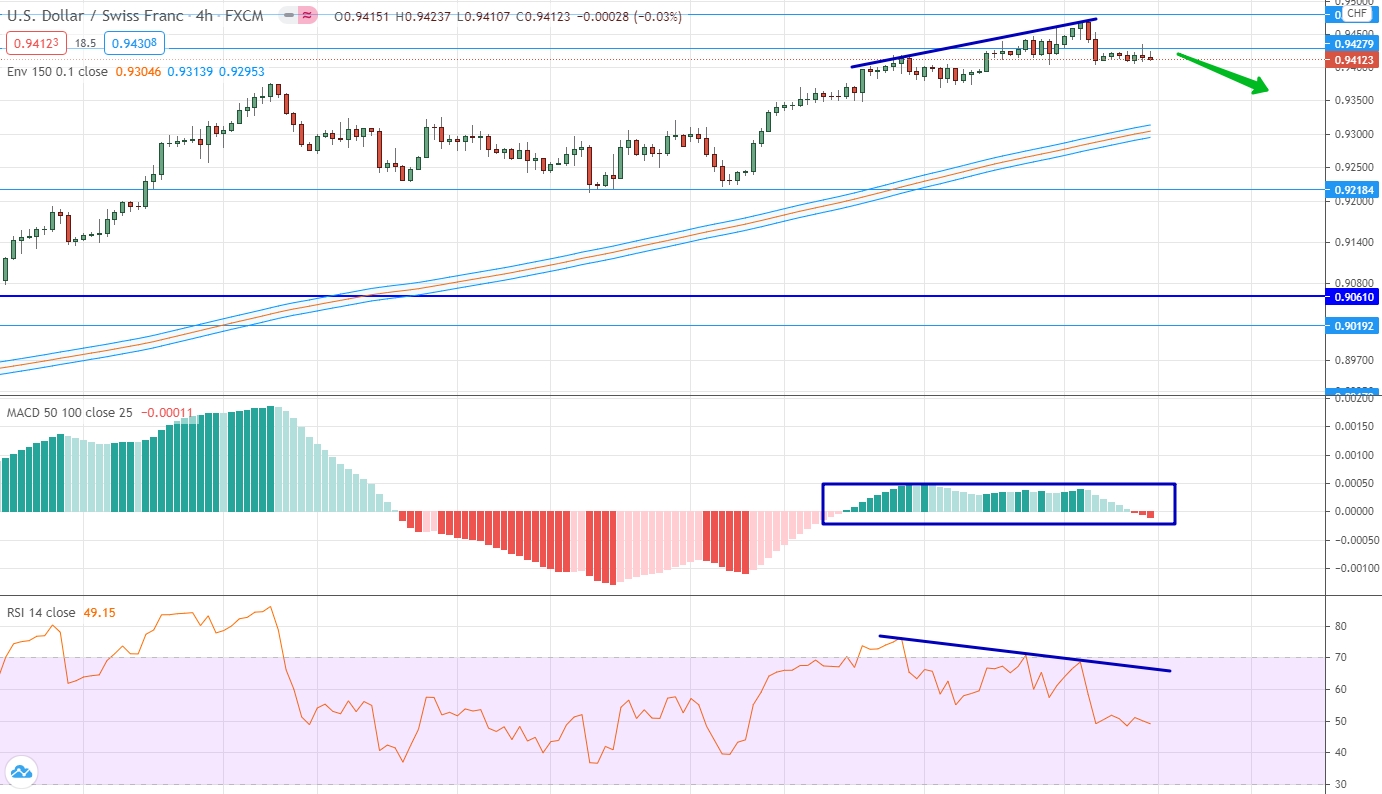
The US dollar traded in the positive area against the Swiss franc last week, but with elements of low volatility. The key stage of trading was carried out at the level of 0.9428. The market attempted to consolidate above this level, but quickly dropped below it. Indicators confirm the absence of volatility and this can be seen especially clearly in the histogram. As for the oscillator, it shows a clear divergence from the price chart. Thus, we can expect that the market will make a correctional movement down to the level of the moving averages.
USD/RUB
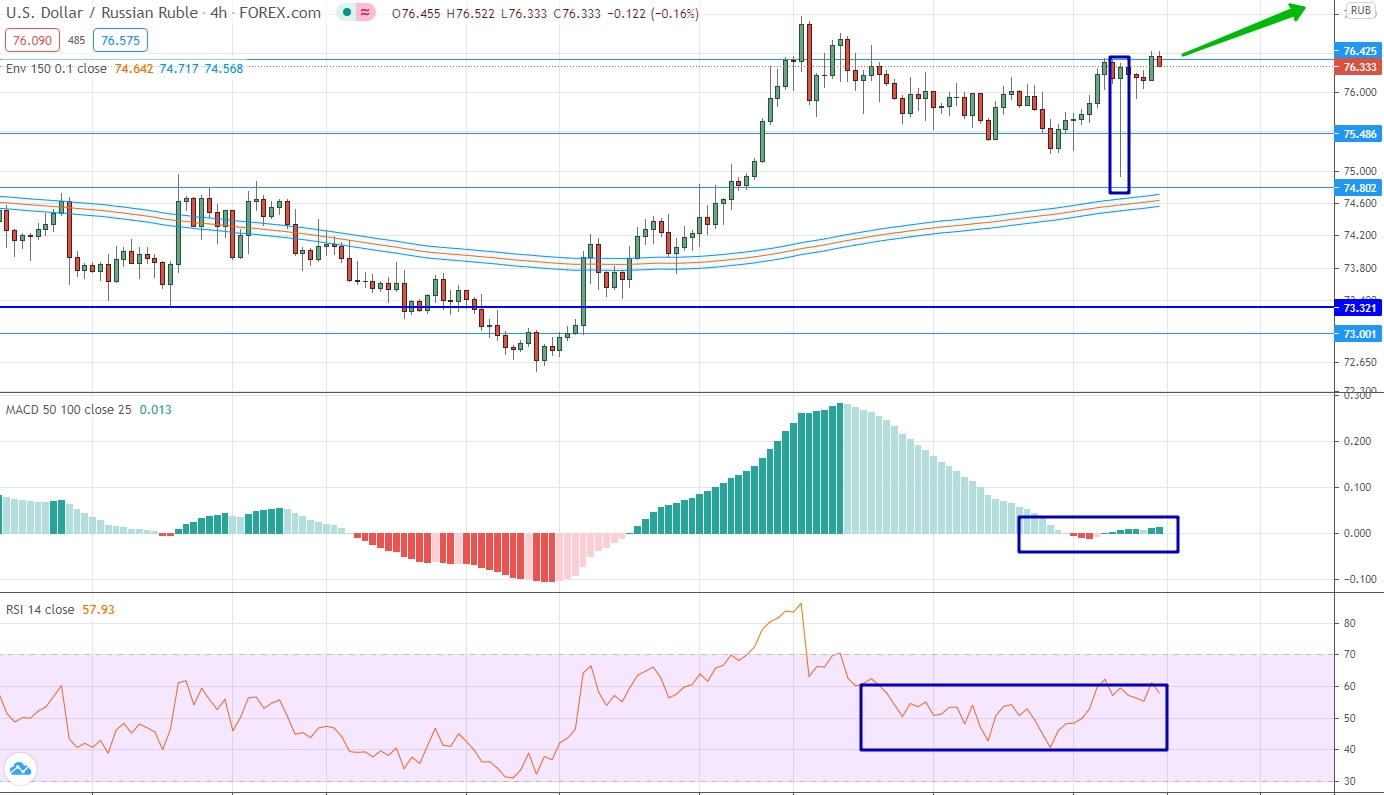
The US dollar continues to form an upward trend against the Russian ruble, although in the last days of last week the upward movement slowed down and somewhat reduced volatility. This can be seen very well from the indicators, which in recent days have been plotted mostly neutral near their zero values. If we consider the price chart, the key level now is the level of 76.42. We also pay attention to the candlestick, which formed close to this level, and which has a short body and a very long shadow downward. This shadow has actually reached the moving average level and the 74.80 level. In classical technical analysis, it is usually said that a long shadow is a harbinger of movement in the opposite direction. Thus, it confirms the uptrend and you can open an up contract.
Gold
The past week has led to a multidirectional movement in the value of gold. We saw a strong downward movement at the beginning of the week, which later gave way to an equally strong upward movement. As a result, the price of gold even dropped to the oversold area. Now we note again that the price has reached the level of moving averages and the price level of 1734.521. Taking into account that the current level is very strong and a downtrend prevails for this underlying asset, you can trade down. Upward trading will be available only if the gold price gains a foothold above the level of 1740.


