Wöchentliche Forex-Prognose und FX-Analyse 15 - 19 März

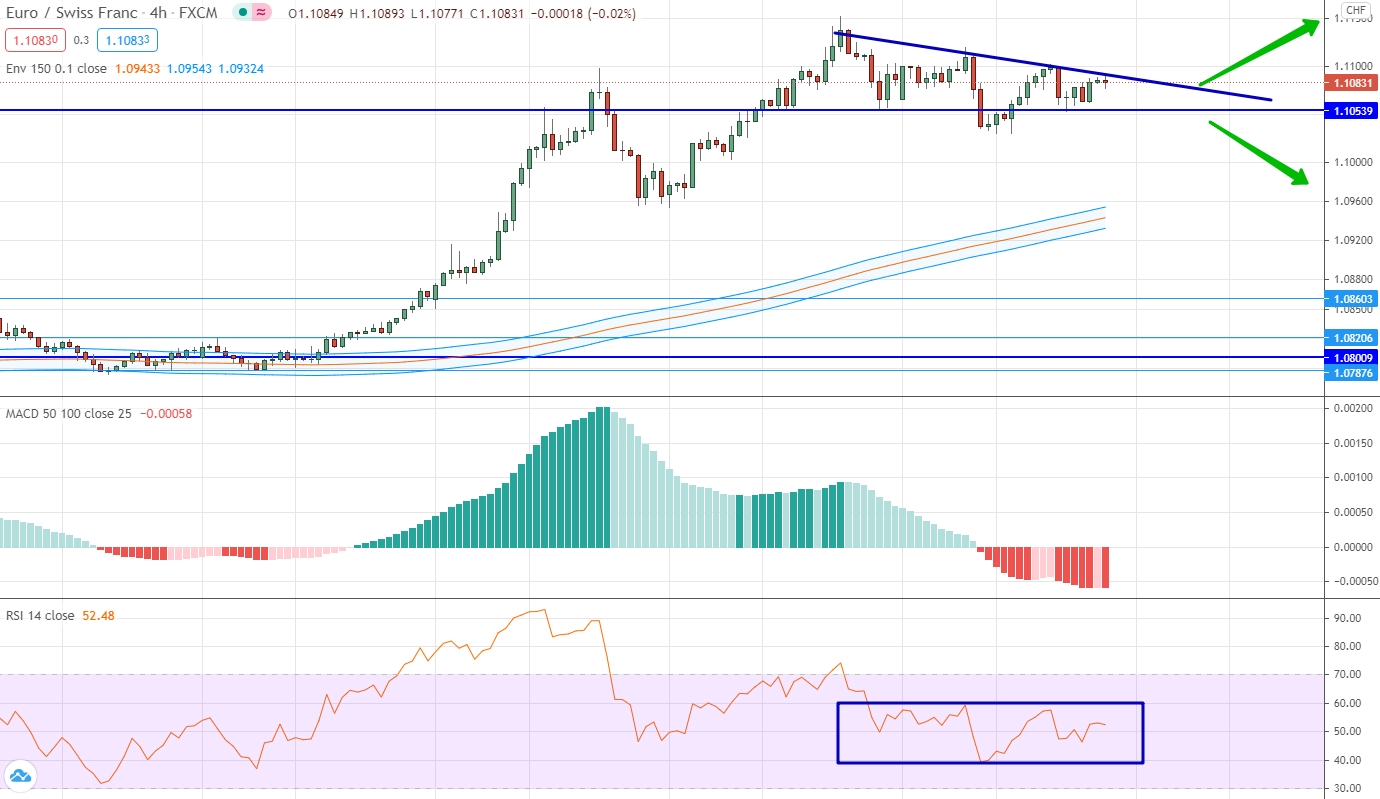
EUR/CHF
The market continues to form an upward trend in the euro against the Swiss franc. However, if you look at the trades of the last weeks, you should note the significance of the 1.1054 level, which together with the downward trend line on the elements of the last corrections form a triangle pattern. This figure is also confirmed by the indicators, since there are no obvious movements in the indicators for the period of building the volatility figure. Therefore, you can use only the basic postulates of technical analysis and wait in which direction the triangle will be broken, and open a contract in the direction of the breakdown. An upward movement is most likely.
NZD/USD
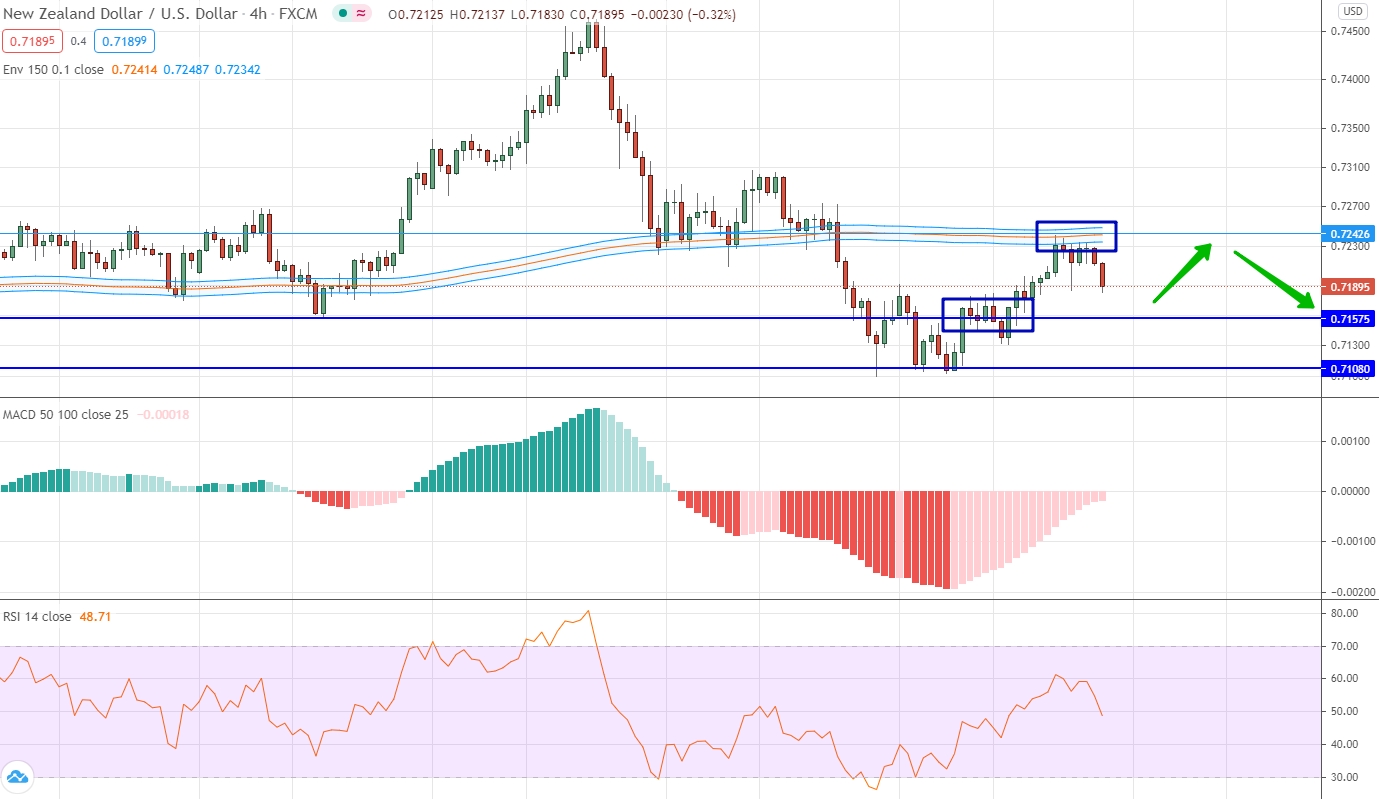
Trading in the New Zealand dollar against the US dollar led to two important things last week. First, the strong level of 0.7157 was broken upwards. Secondly, the price reached the strong level of 0.7240 and the upward movement ended there. The last level is interesting in that it practically coincides with the levels of the moving averages. Thus, the 2 designated levels form a sideways range between each other, which has exceptional strength in the current market situation. Therefore, you can trade based on the indicators of oscillators from level to level.
EUR/RUB
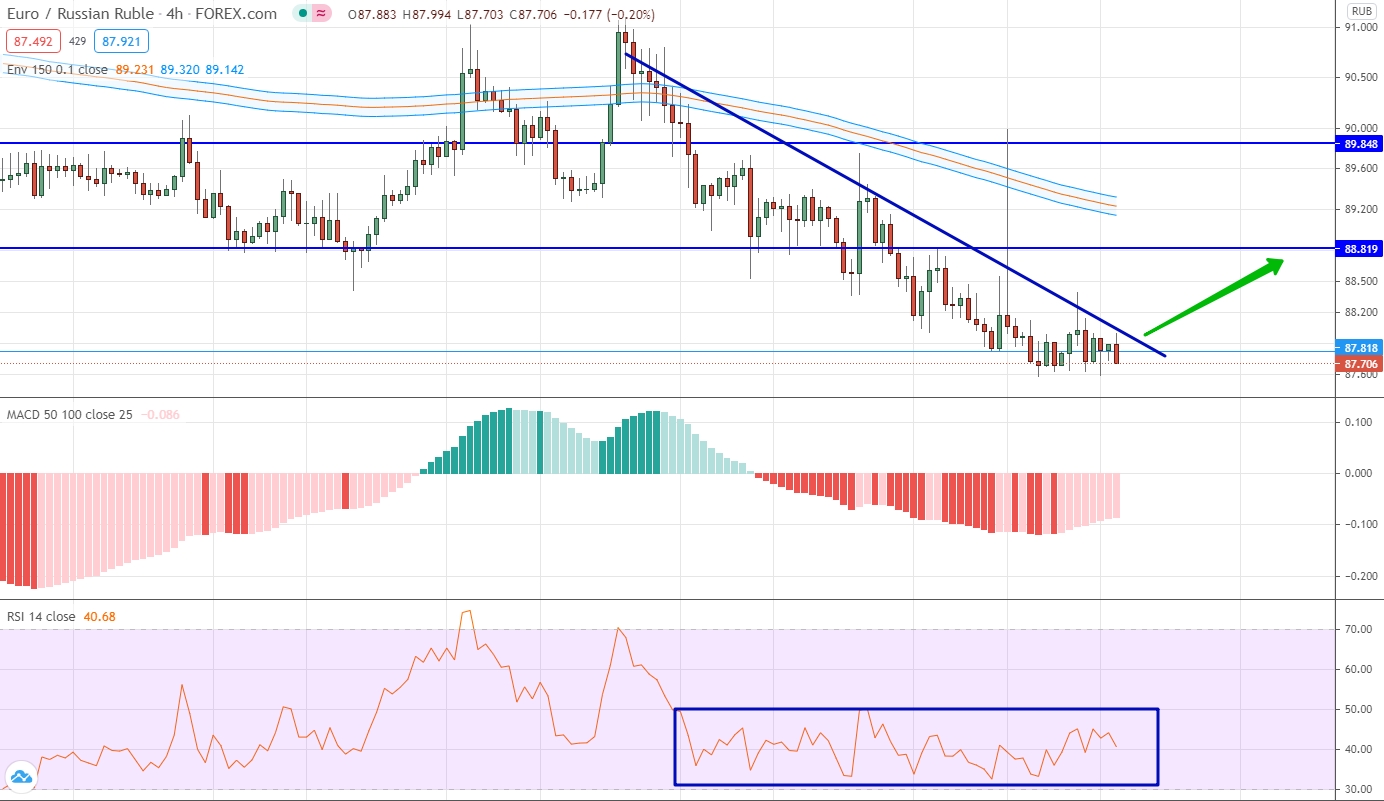
The euro continues to form a downward movement against the Russian ruble, however, this movement has slowed down quite a bit, reaching the level of 87.81. The downward movement is clearly visible on the price chart and indicators, each of which are in negative positions. Taking into account that the market is at the local minimum and the downward slope is quite steep, we can expect only a corrective upward movement, but the transaction will be possible only when the price is above the trend line indicated on the chart.
AUD/CHF
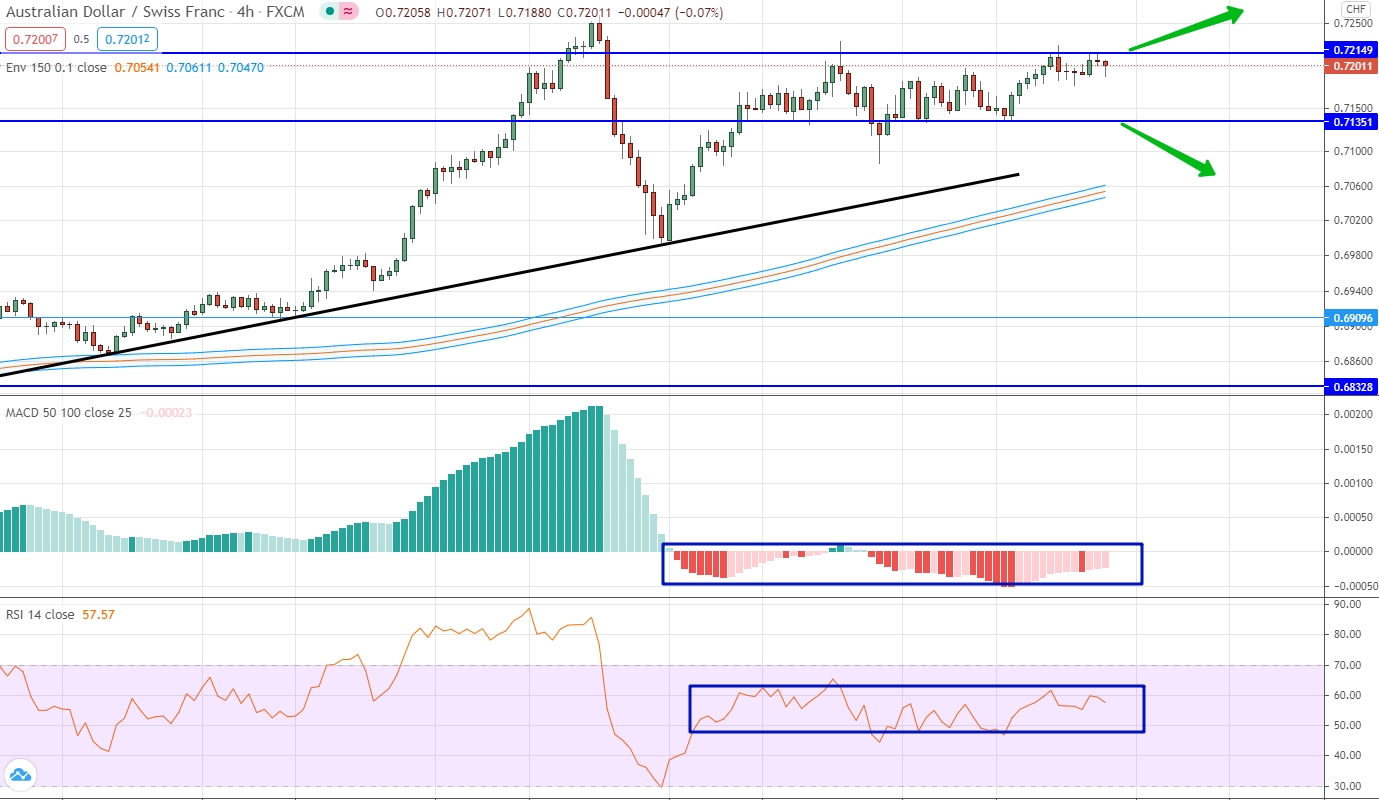
Trades in the Australian dollar against the Swiss franc in the past weeks are characterized by the absence of volatility and minimal spread in the price movement. The upward dynamics continues to be relevant, but here and now its horizontal correction is taking place. We are obliged to select a sideways range with the boundaries of 0.7135 and 0.7215. You cannot trade as long as the price is within this range. We are waiting in which direction the range will be broken and open a contract in the direction of the breakout. The range is most likely to be broken upward.
GBP/CAD
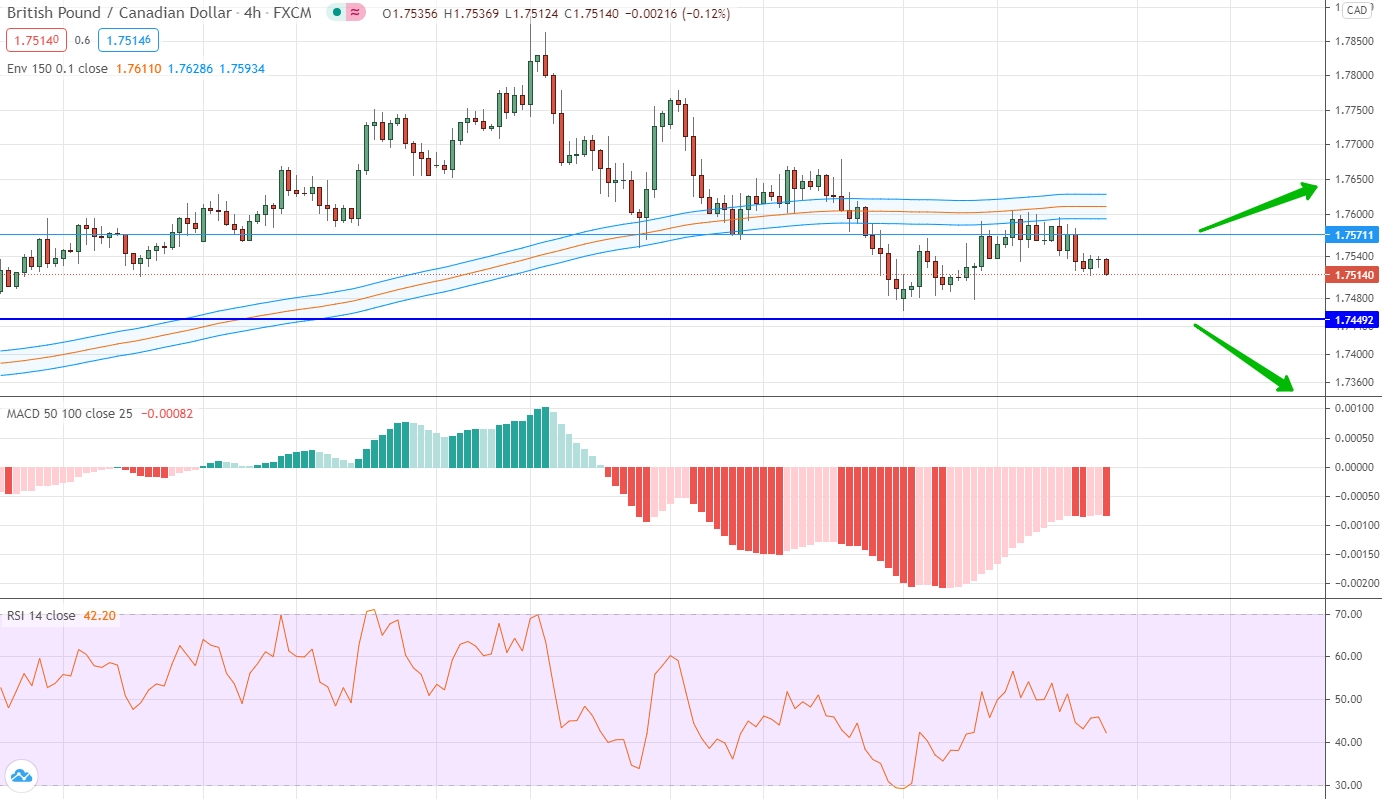
This currency pair, if we consider trades for more than a month, has a downward slope and is traded mostly negatively, which can be seen both on the chart and on the indicators. Based on the chart, it is important to note that the price has consolidated below the moving average level, but the price is trapped inside the sideways range of 1.7450 and 1.7571. Once again, within the framework of this weekly review, we are forced to say that there is no volatility in the currency pair and it is impossible to trade in such conditions. You need to wait in which direction the range will be broken. In this case, a downward breakout is most likely, since this range and the price are limited from above by moving averages.
NZD/CHF
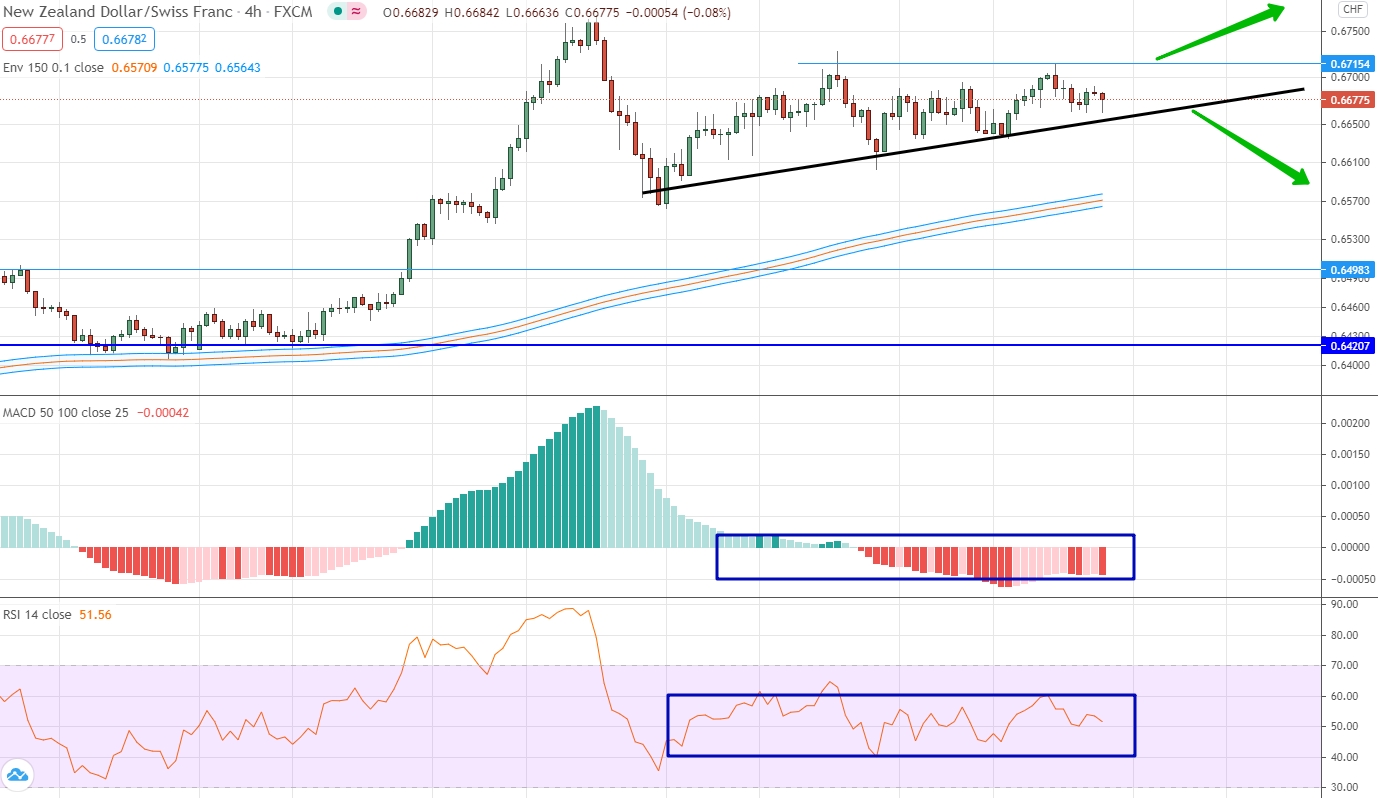
The New Zealand dollar is trading in an uptrend against the Swiss franc. At the same time, the upward movement is characterized by the absence of volatility and minimal spread. This is very clearly seen in the indicators, which actually do not separate from their neutral values. Nevertheless, the uptrend line is traced very well, as is the significant level of 0.6715. These lines together form a geographic triangle pattern and as long as the price is within this pattern, you cannot trade. The market is very close to the top of the chart pattern, so it won't be long to wait. We expect in which direction this chart pattern will be broken and open a contract in the direction of the breakout.
USD/CNH
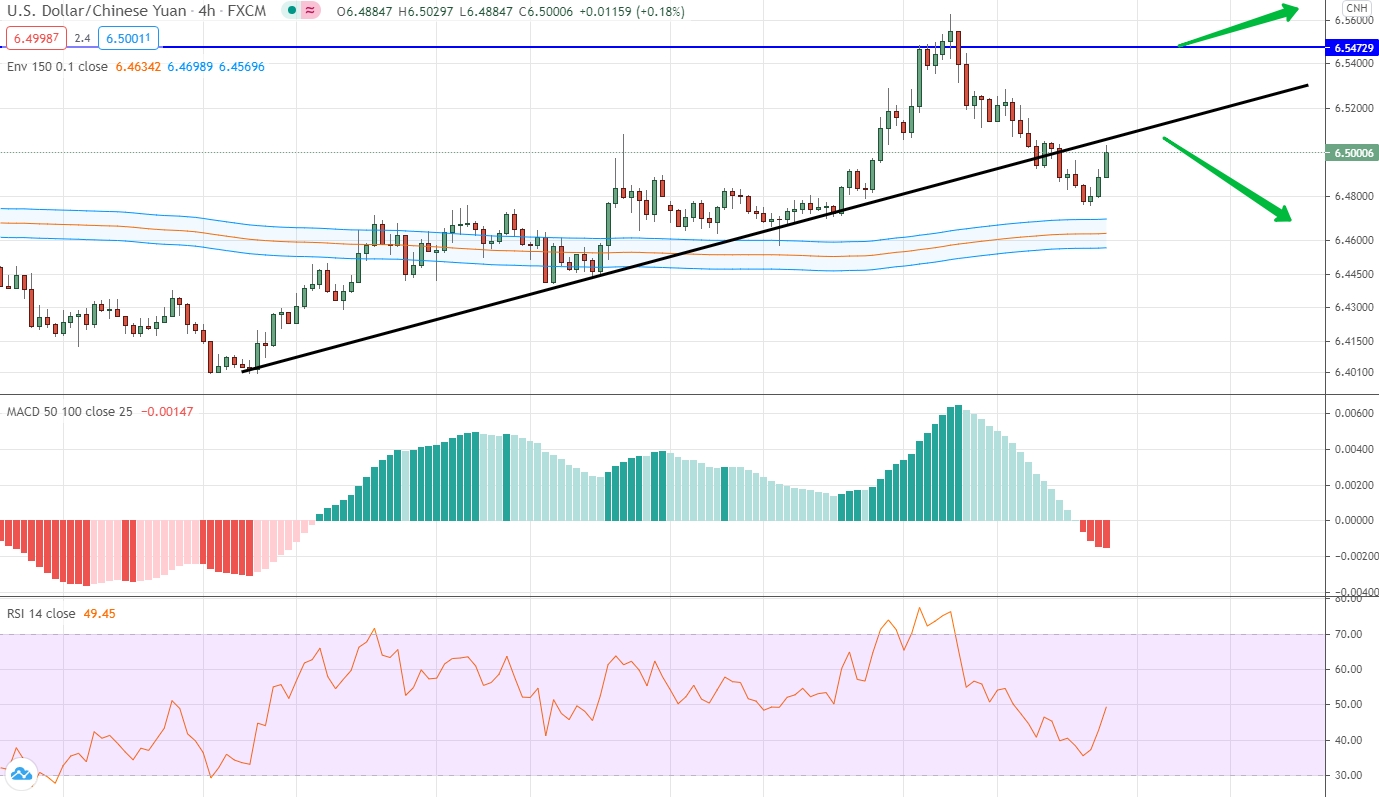
Американский доллар против китайского юаня развивает восходящий тренд, но это движение было приостановлено на уровне 6,5473. Более того, после этого произошло достаточно сильное нисходящее движение, в результате которого цена оказалась ниже трендовой линии и достигла уровня скользящих средних. Таким образом можно ожидать что коррекция продолжится, а значит можно открывать нисходящий контракт. В текущих условиях открытие восходящего контракта будет возможно только если цена окажется выше уровня 6,5473.
