Previsão e Análise Forex Weekly Forecast 09 - 13 de Novembro

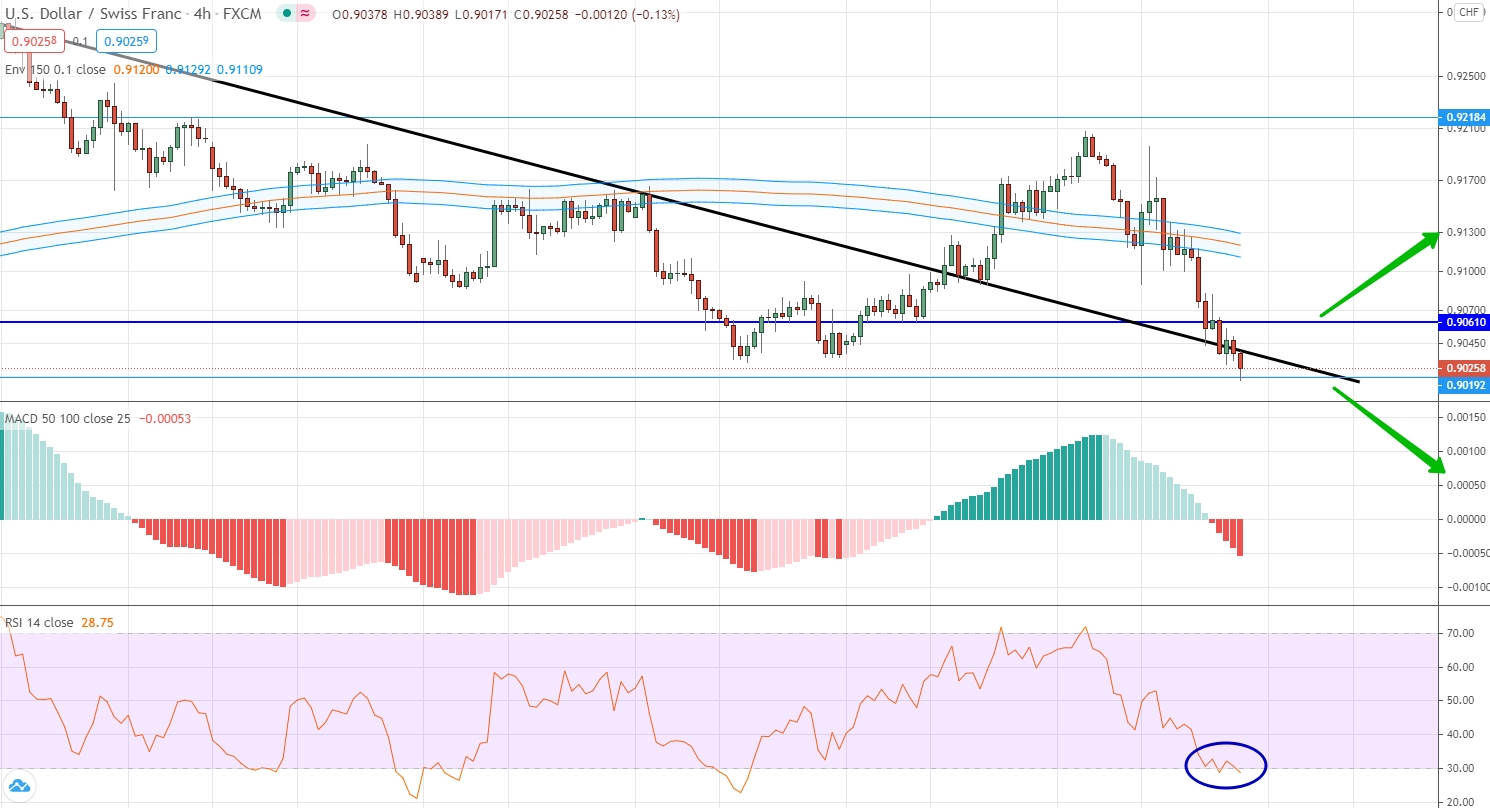
EUR/CHF
For a given currency pair as a whole, we can state elements of high volatility and a tendency towards a downward movement. At the current stage, the key level for the price is the level of 0.9061. The general trend is negative and the market has all the prerequisites for continuing the fall, but it will be possible to open a contract for a fall only if the price managed to gain a foothold below the level of 0.9019. If the market manages to rise above the level of 0.9061, then it will be possible to trade up.
NZD/USD
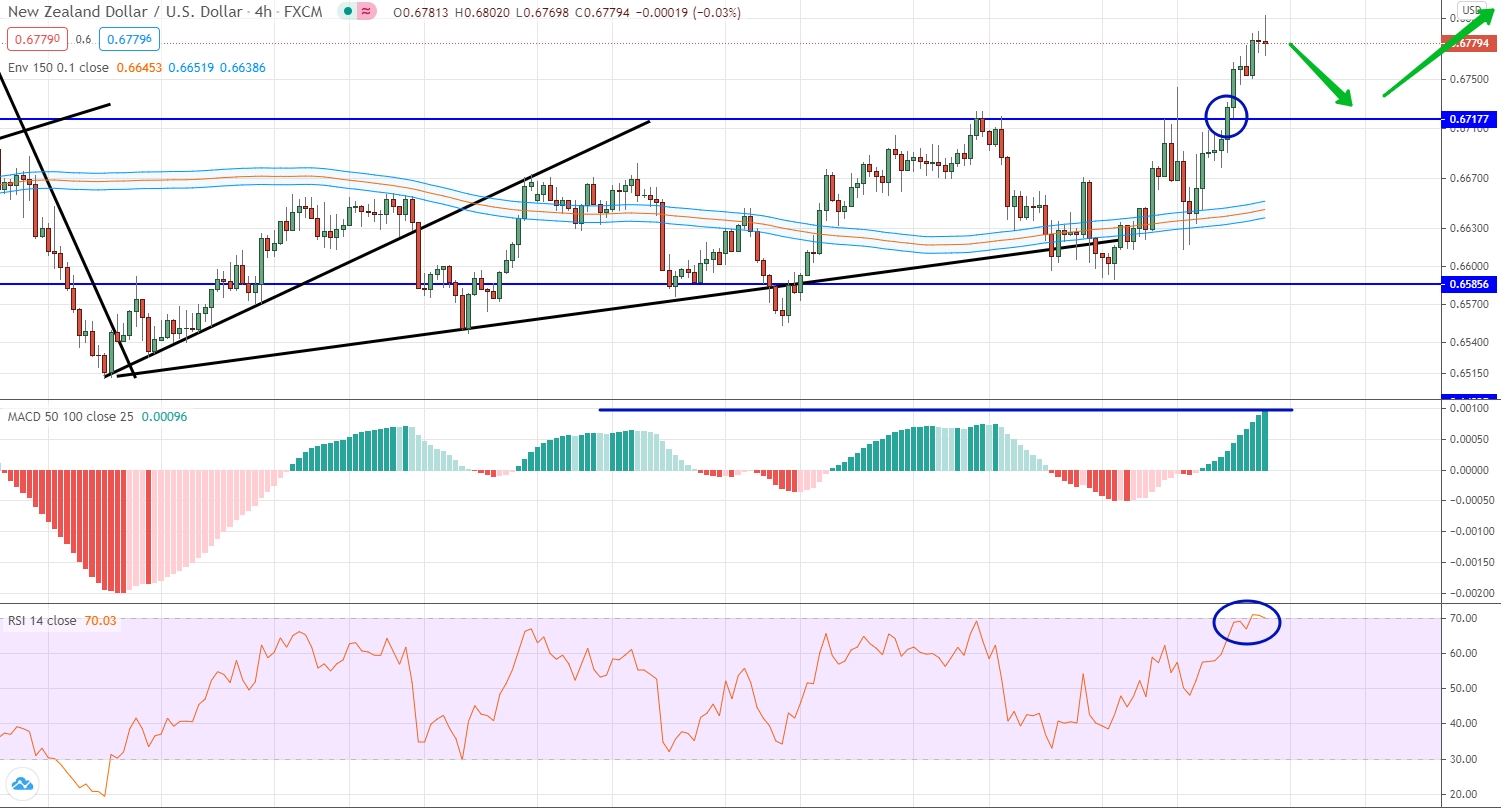
The past week led to a significant upward movement of the New Zealand dollar against the US dollar. The movements turned out to be so significant that they managed to rise above the psychological level of 0.6717. This movement led to the fact that the histogram was at a local maximum, and the oscillator for the first time in a very long time rose into the overbought area. Thus, here and now, there is no need to talk about the possibility of continuing the current trend and trading upward. We expect a correction movement, and only after that it will be possible to consider options for opening up contracts.
EUR/RUB
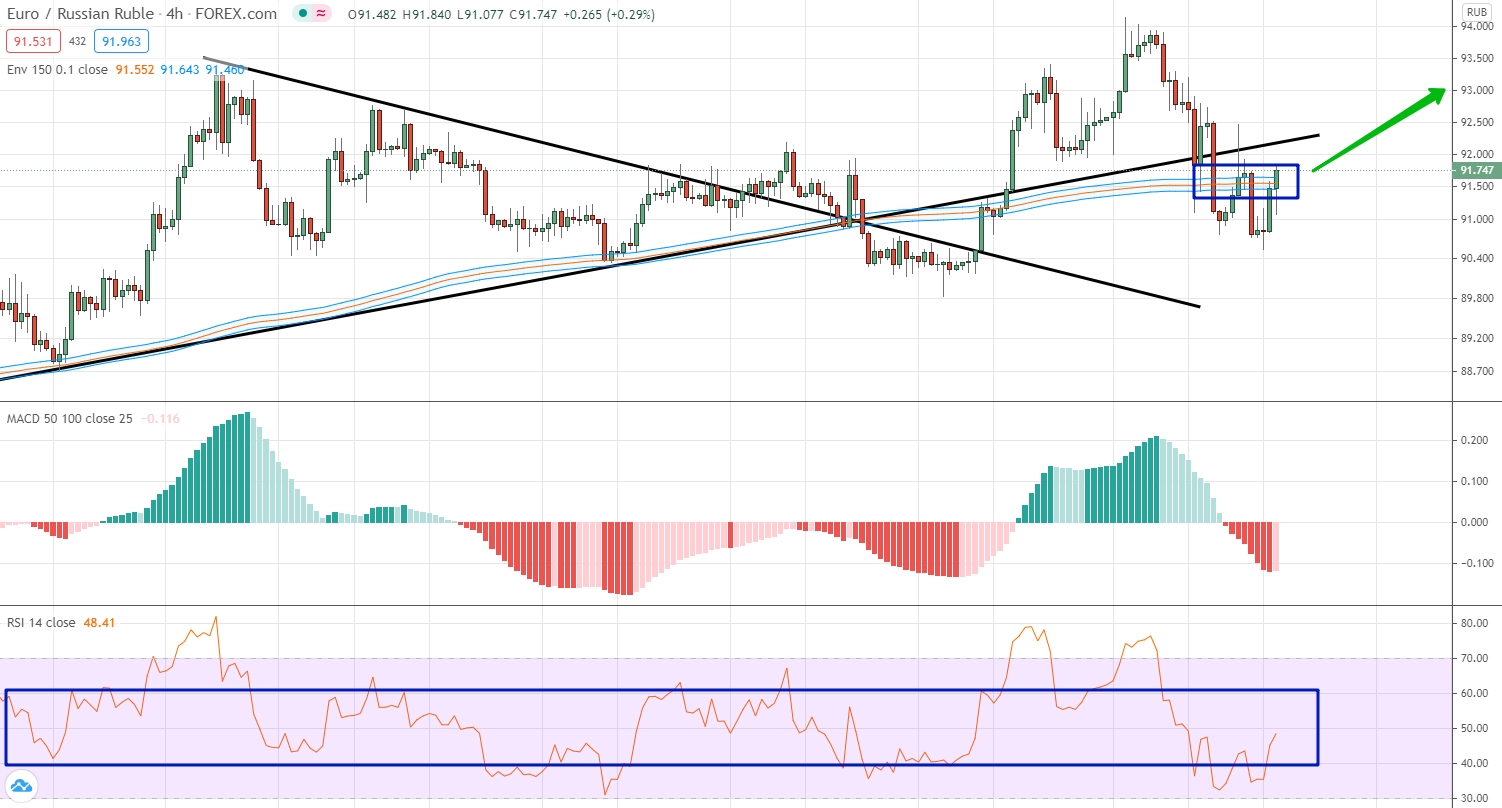
The main characteristic of the euro against the Russian ruble in the trading of the past weeks is the high volatility of the currency, as well as the inability to move directionally and the significant distance from the level of moving averages. Thus, we have practically described the ideal flat situation. Therefore, we note the fact that even here and now the market is in the area of moving averages and cannot significantly move away from it. Taking into account the fact that the oscillator is moving upwards, we can expect that the upward movement will continue in the coming week and it will be possible to trade upward.
AUD/CHF
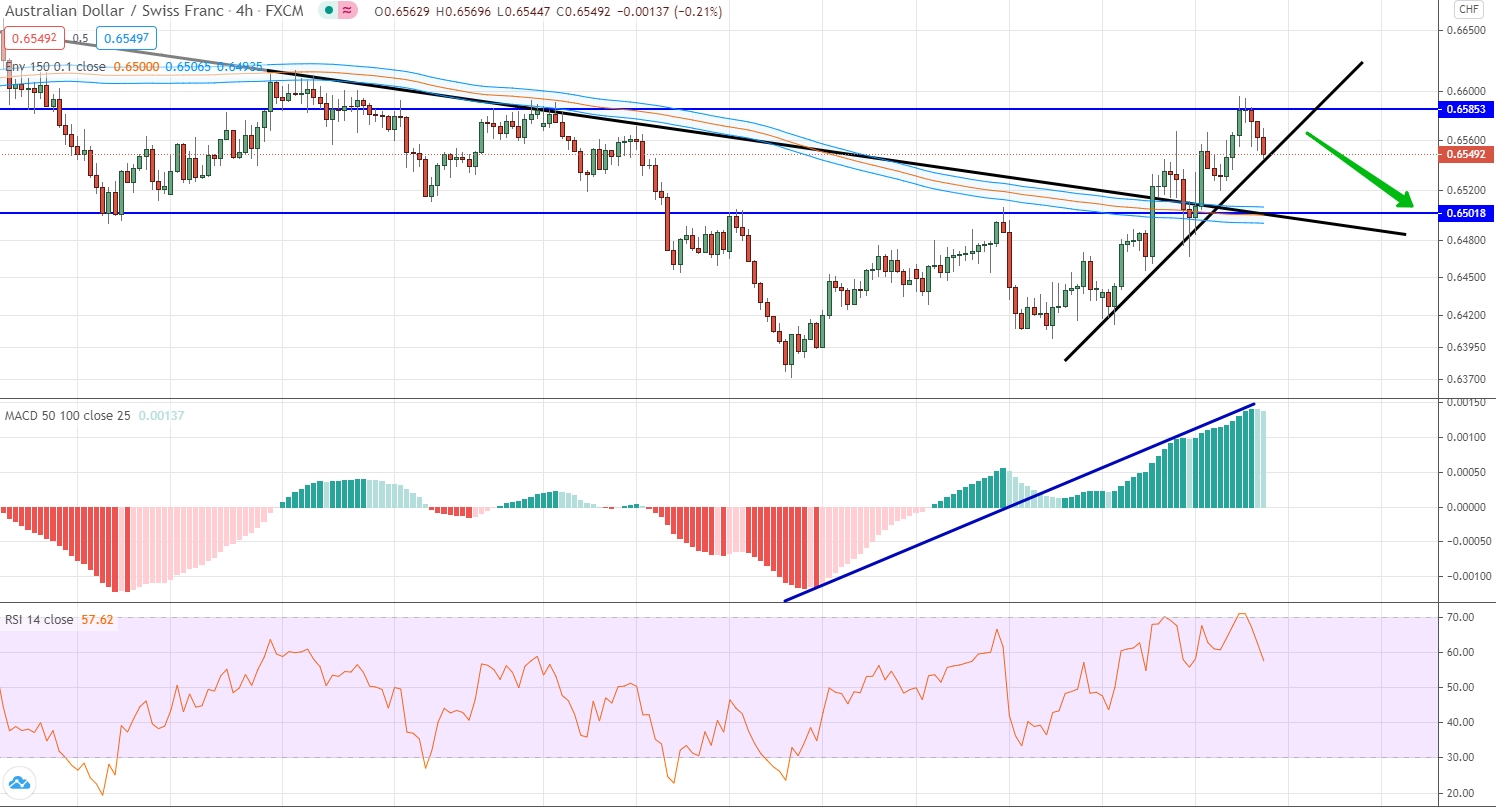
The past week has led to a very strong upward movement for this currency pair. This movement is clearly visible along the uptrend line, which has a very steep upward slope. This movement led to the fact that the price was again within the broad range of 0.6501 and 0.6585. In general, the market is looking downward. This can be clearly seen both along the trend line and on the level of moving averages. In this regard, the current positions of the indicators do not seem to be of particular importance, since they have not given trading signals for a long time. We can say that as soon as the price is below the current uptrend line, then it will be possible to trade down with the target at the lower border of the sideways range.
GBP/CAD
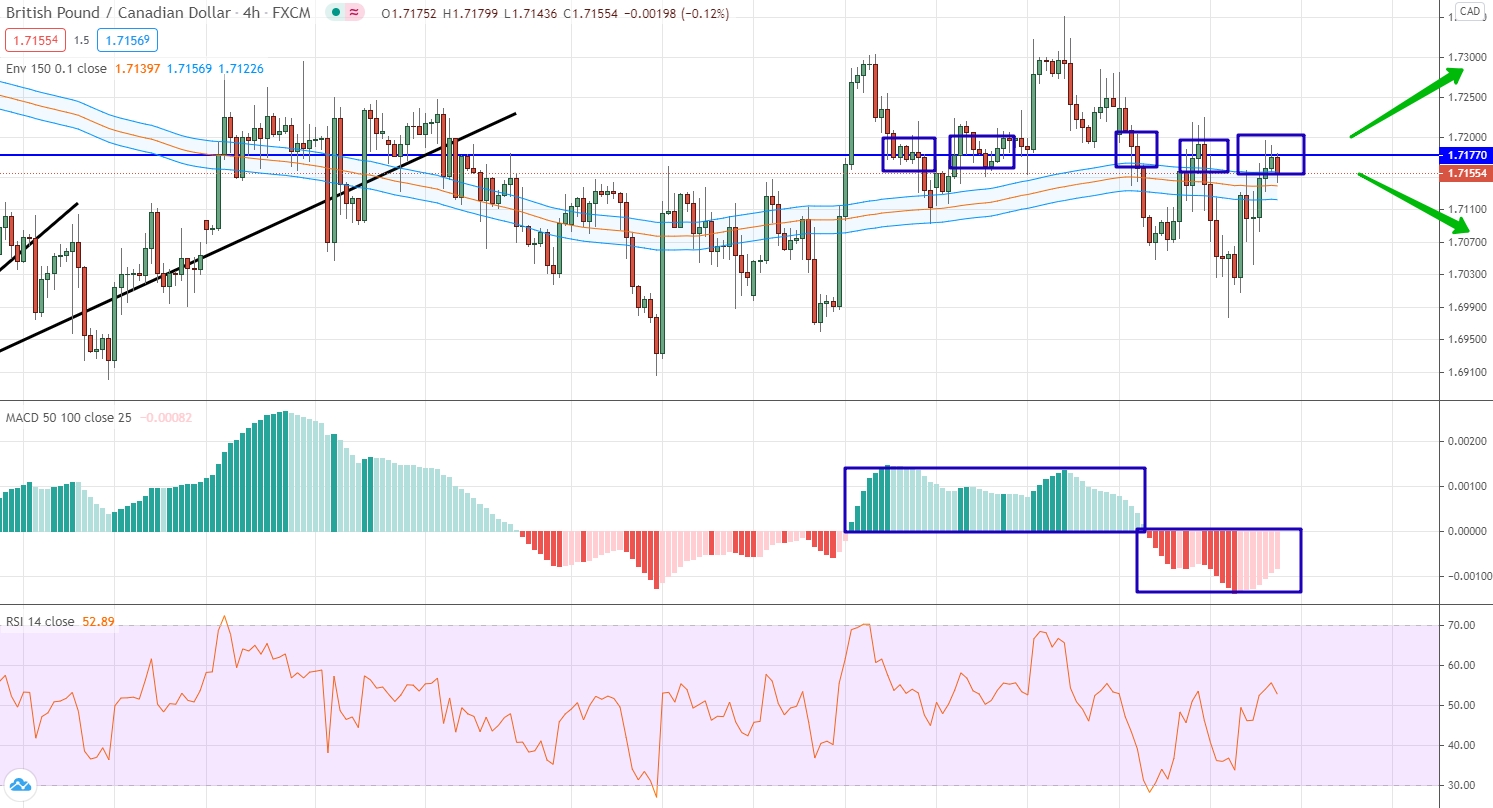
For the British pound against the Canadian dollar, the key level is 17177 point, we see at least five situations within the past weeks, when this level was tested, reacted to this level, and after that it moved either up or down the points separately, we pay attention to the histogram, which cannot form a strong movement in any direction and also constantly alternate the color of the columns. thus, we can only say that the level indicated above will be critical and only on the basis of it it will be possible to trade the contract. the actual direction from this level the market will start moving in that direction and it will be possible to trade.
NZD/CHF
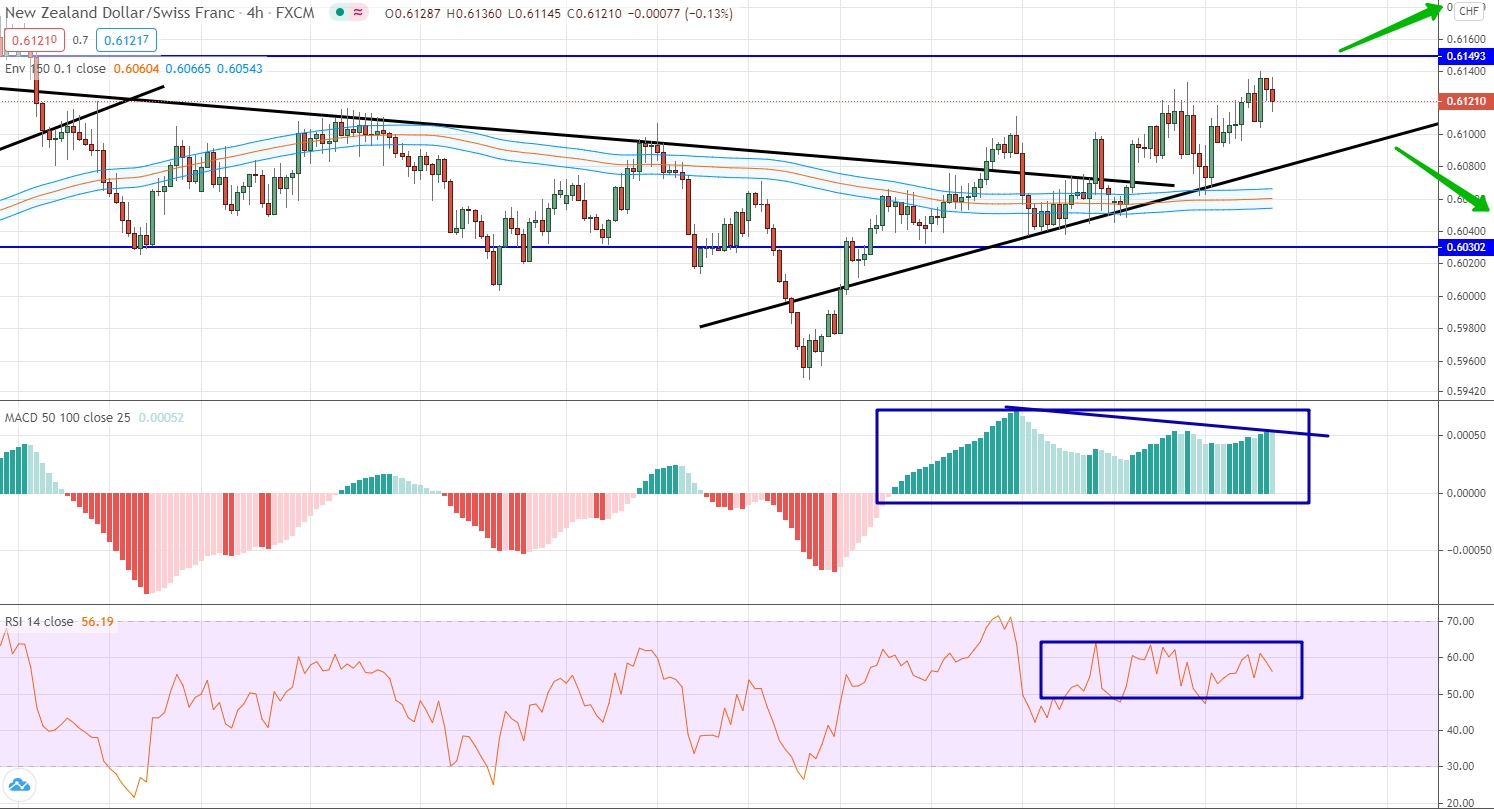
For this currency pair At the current stage of its development, the key price level is 061 49 points, the growth of the last weeks allows to draw an upward trend line, which forms an atypical triangle with the level indicated above. nevertheless, we note that until it is again inside this triangle, it is impossible to say, since the situation for trading is an unfavorable point, firstly, we say that the oscillator does not show a tendency to volatility and practically does not develop; secondly, we note the fact that there is divergence between price and histogram. therefore, you just need to wait in which direction the market will come a triangle and open a deal in the direction of this.
USD/CNH
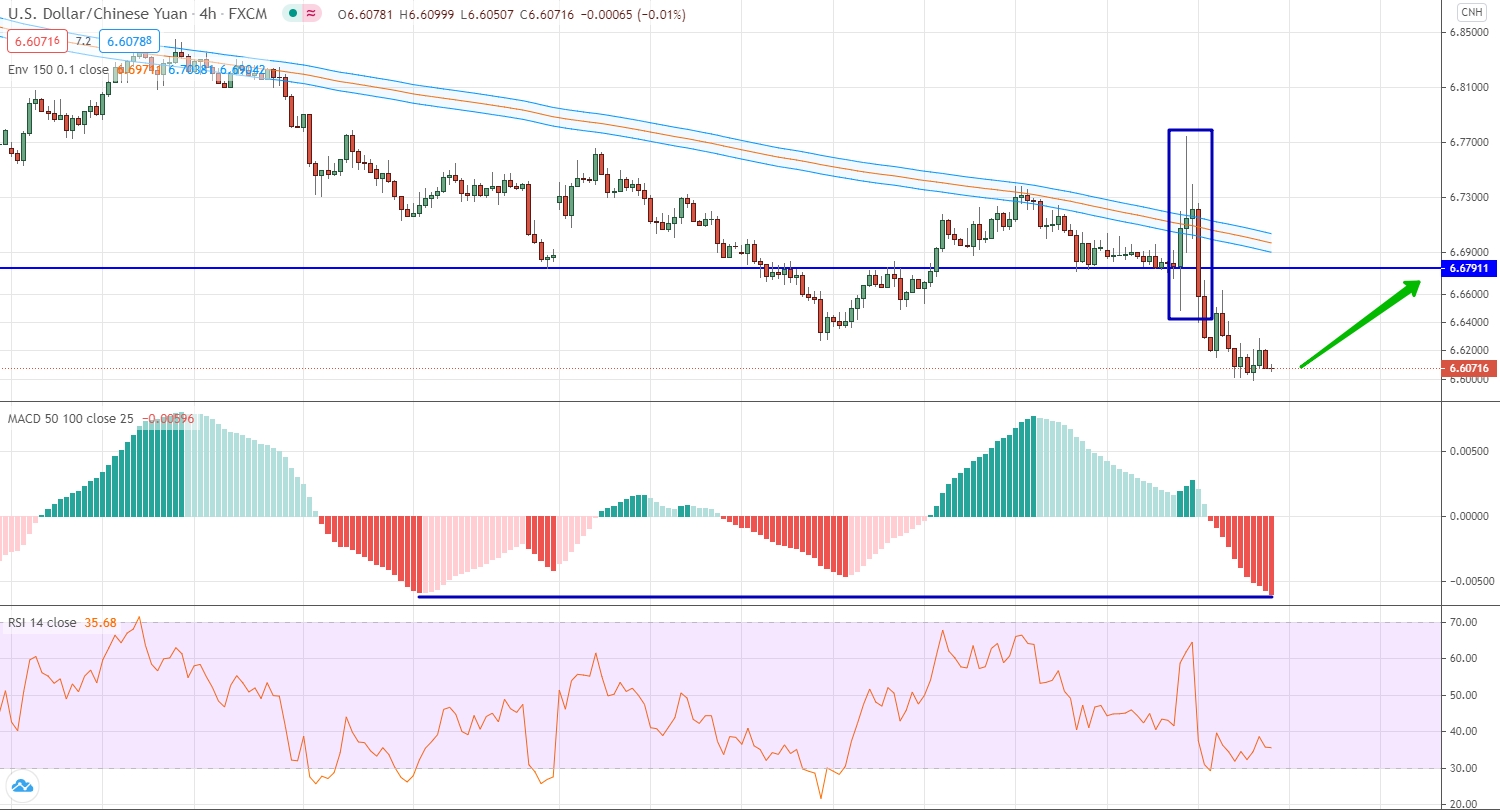
The dollar still cannot form an upward movement against the Chinese yuan. Last week, the currency pair made a strong volatile movement in the area of the level six, 6791 and in the area of moving averages. this was followed by a strong downward movement, during which the price ended up at local lows, which is confirmed by most of the indicators. Taking into account a fairly strong downward movement and local minimum values, we can expect that the market will need a correction, it means the expectation of an upward movement and trade up.
