Previsão e Análise Forex Weekly Forecast 24 - 28 De Maio

EUR/USD
An uptrend is still developing for the euro against the US dollar, which has significantly strengthened within the last week. In the current situation, we can state the fact that the price has consolidated above the level of 1.2165. In this case, in contrast, you can bring the indicators of the oscillator, which looks down. Nevertheless, the upward dynamics is dominant, and it is very clearly seen how the market reacts to the levels of moving averages, bouncing up from them. Therefore, we can consider trading options for an increase, but the contract can be opened only after a downward correction.

GBP/USD
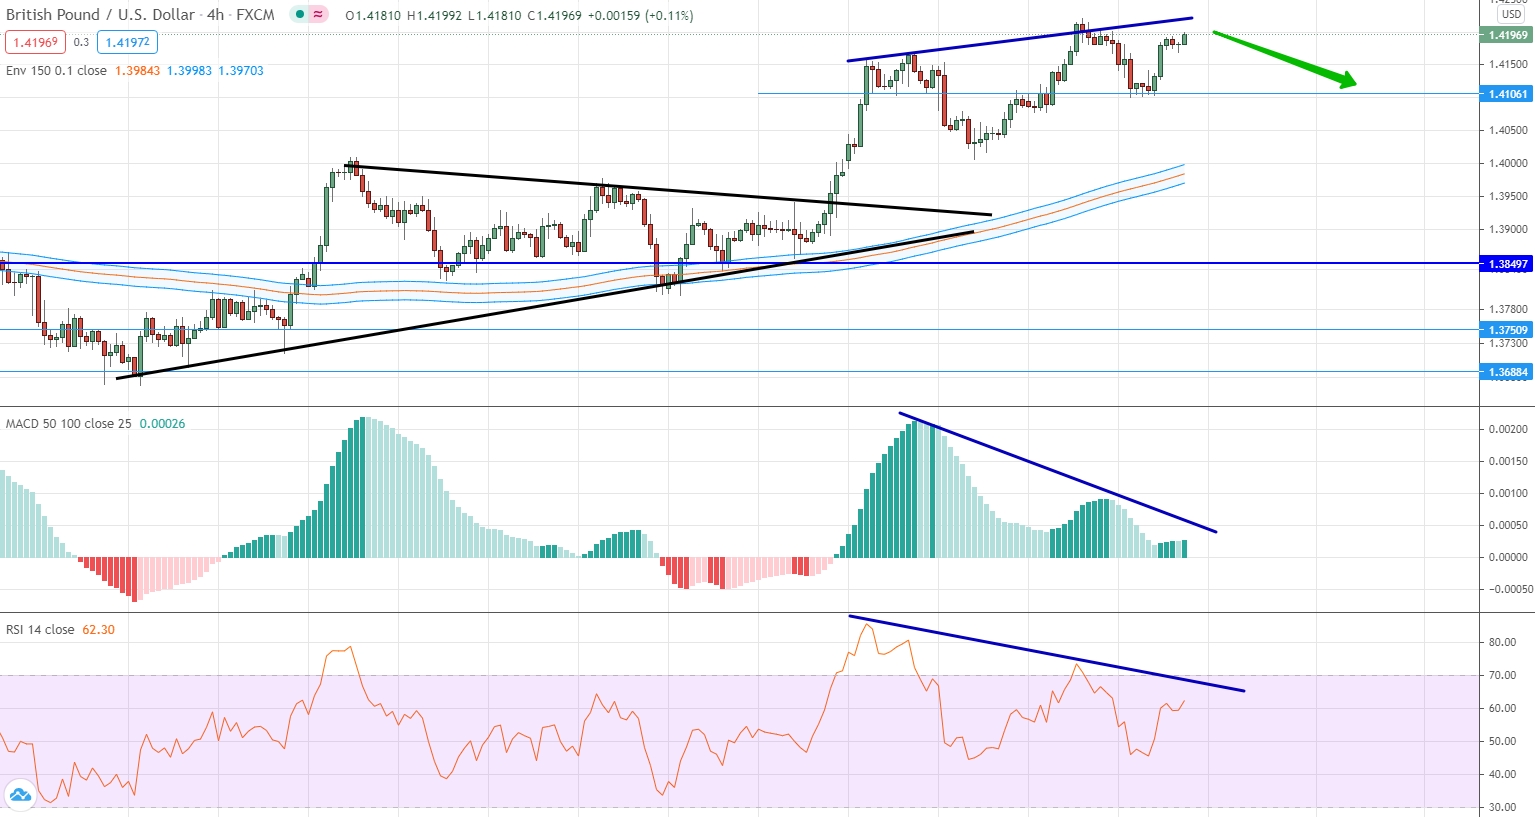
This currency pair continues to work out the triangle pattern, which we talked about in one of the previous weekly reviews. The upward dynamics continues to strengthen and the market has already significantly moved away from the level of moving averages. At the same time, comparing the value of the British pound against the US dollar and indicators, we see a contradiction. If the price rises and constantly updates its maximum values, then the indicators look down. Taking into account that the market is at its maximum, and indicators with the price form a divergence, we can expect a downward movement.
USD/JPY
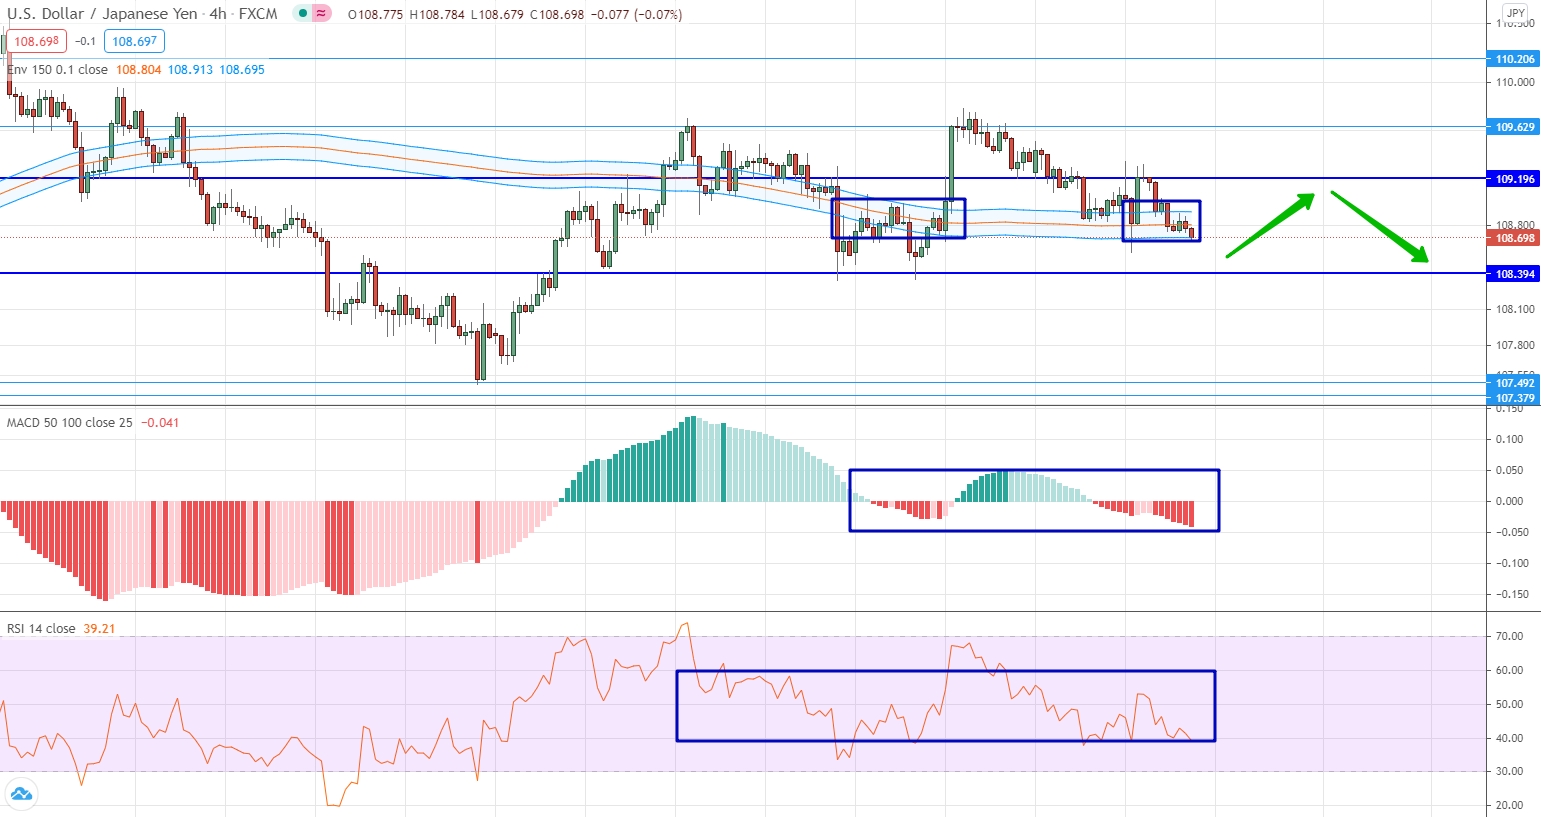
The US dollar against the Japanese yen is still developing in a stage of low volatility and mainly in sideways dynamics. The sideways movement is clearly visible both on the price chart, where the market literally sticks to the level of moving averages, and on indicators that are close to their neutral values. Now we can distinguish a side corridor with borders 108.395 and 109.200. The corridor is very significant and it is generally expected that the price will develop within this corridor.
AUD/USD
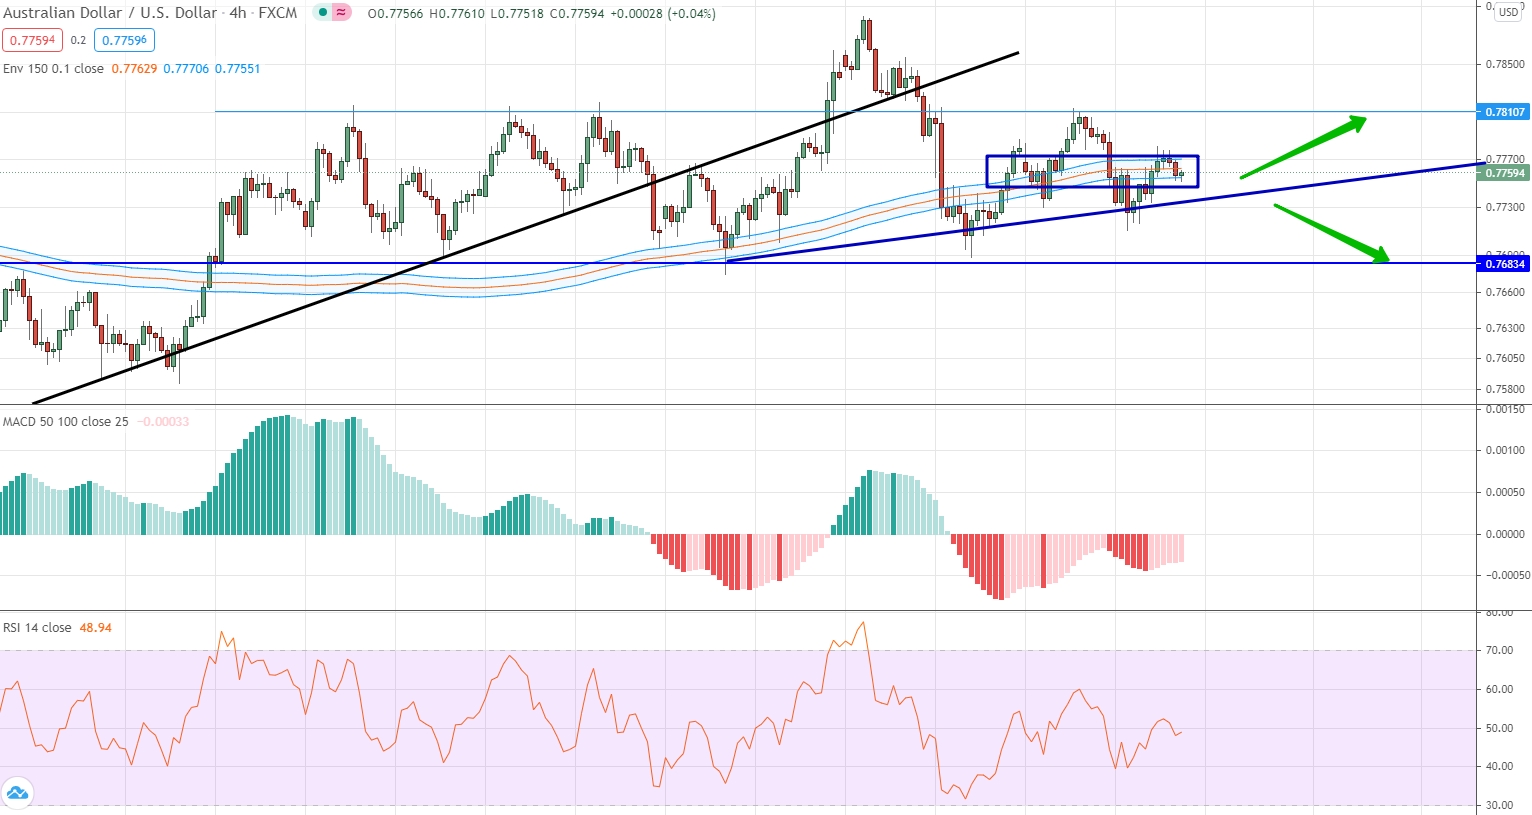
For the Australian dollar against the US dollar, an uptrend still dominates, which, however, is now in the stage of some correction. The most important characteristic of the current market situation is the tendency of the market to converge with moving averages. We have been observing this dynamics in recent weeks. Nevertheless, the upward dynamics does not lose its strength and remains. Therefore, you can only consider options for trading up. If the market moves down and consolidates below the second trend line, then it will be possible to open a contract for a fall with the target at 0.7683.
USD/CAD
For the US dollar against the Canadian dollar, a downtrend is still forming in the market. Therefore, the most important characteristic of the market is that the price continues to fall, but the indicators have been looking in the direction of growth for a long time. The oscillator is already in neutral positions, and the histogram has been in the positive area for a long time. On the price chart itself, we can distinguish a sideways range with the boundaries of 1.2020 and 1.2190. This range is strong and it is very likely that the price will develop within this range until it approaches the level of the moving averages.

USD/CHF
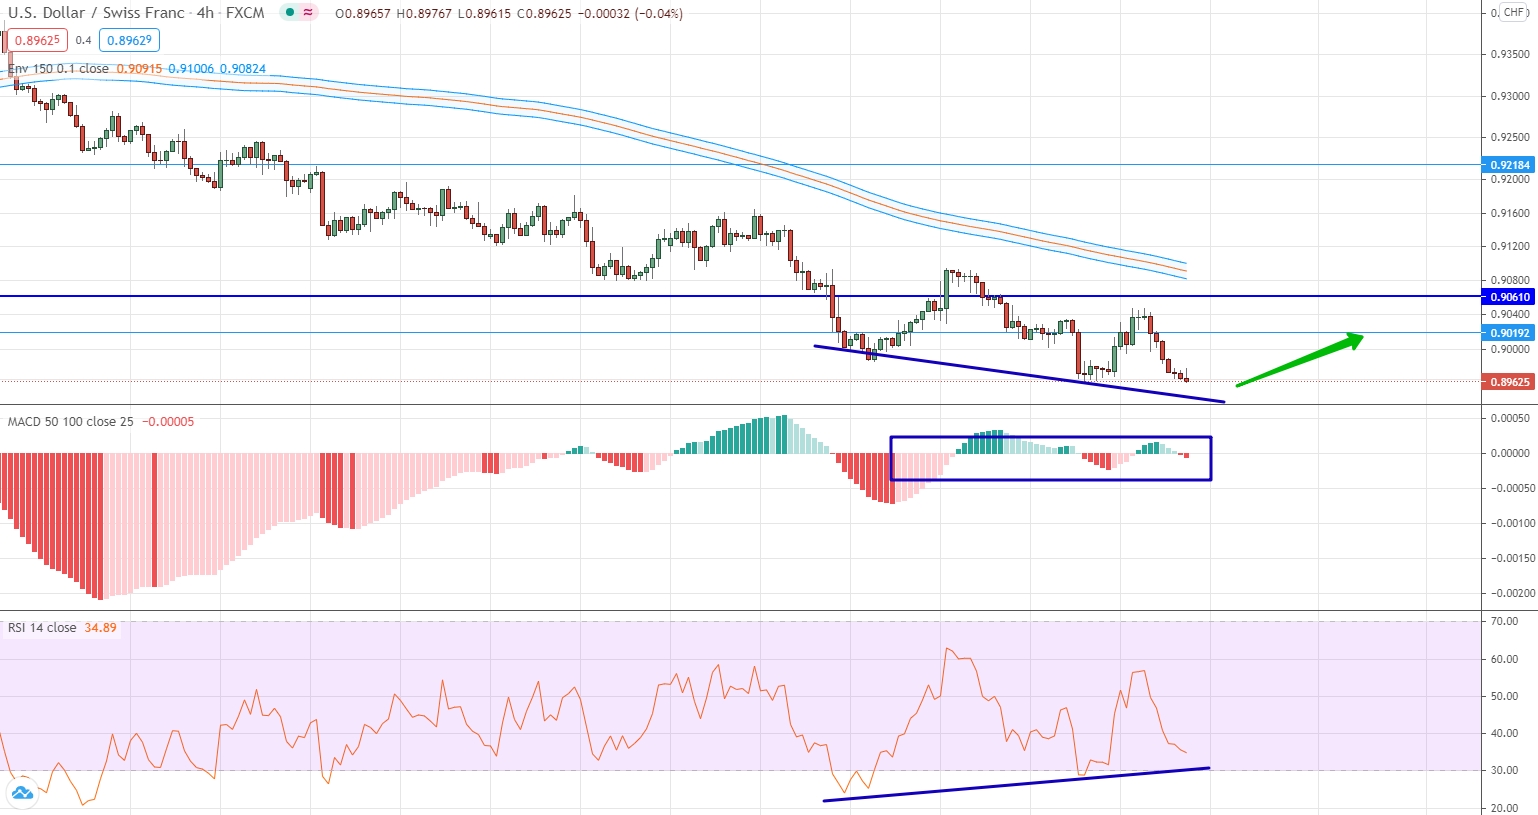
The dollar continues to develop a downtrend against the Swiss franc, but indicators indicate low volatility and no clear movement. This is especially evident in the histogram, which literally stuck to zero values and does not move away from them much. As for the oscillator, it looks in the direction of growth, despite the fact that the market is looking in the direction of falling. Thus, divergence is formed. Therefore, we can expect the price to make a corrective upward movement towards the strong level of 0.9019.
USD/RUB
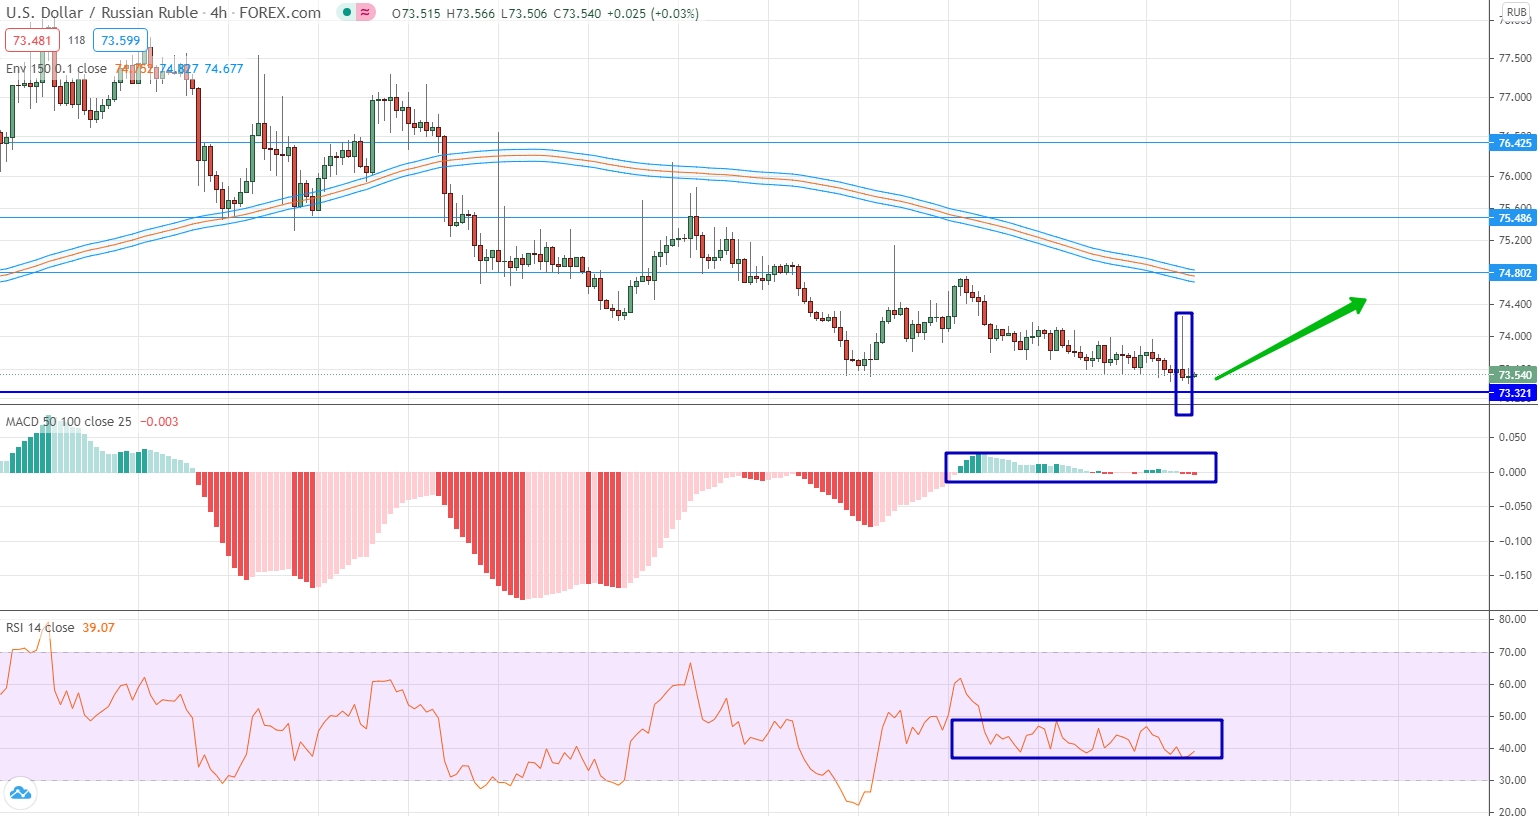
The key characteristic of the trades in the US dollar against the Russian ruble over the past week is the absence of volatility and a slightly downward movement. Downward movements led to the fact that it has almost reached the level of 73.32, but the indicators practically do not make any movements. This is a characteristic of all indicators for a given currency pair. The only thing we can talk about is the market approaching an important level, as well as the formation of a candlestick with a very short body and a very long upward shadow. Thus, it can be a harbinger of an upward movement, which means we open a contract in the direction of growth.
Gold
Gold continues to trade positively, updating the local maximum for itself. Nevertheless, now we can think about trading for a fall. This is due to the fact that the current price indicators are in conflict with the current indicators. If the price continues to rise and renews the maximum values, then the indicators are already looking down. Thus, price divergence is formed with all graphic instruments. Therefore, you can open a contract for a decrease with the nearest target at the level of 1856.164.


