Forex Weekly Forecast & FX Analysis June 28 - July 2

EUR/USD
The euro reached the level of 1.1863 against the dollar, after which it turned around and began to move upward. The upward movement is not strong, but it can be traced both on the price chart and on indicators. In fact, we can say that the market has reached an important level and then reversed. Hence, we can consider bull trading options. It is impossible to open deals here and now, since we are on the descending part of the market, which means we are trading against the trend.

GBP/USD
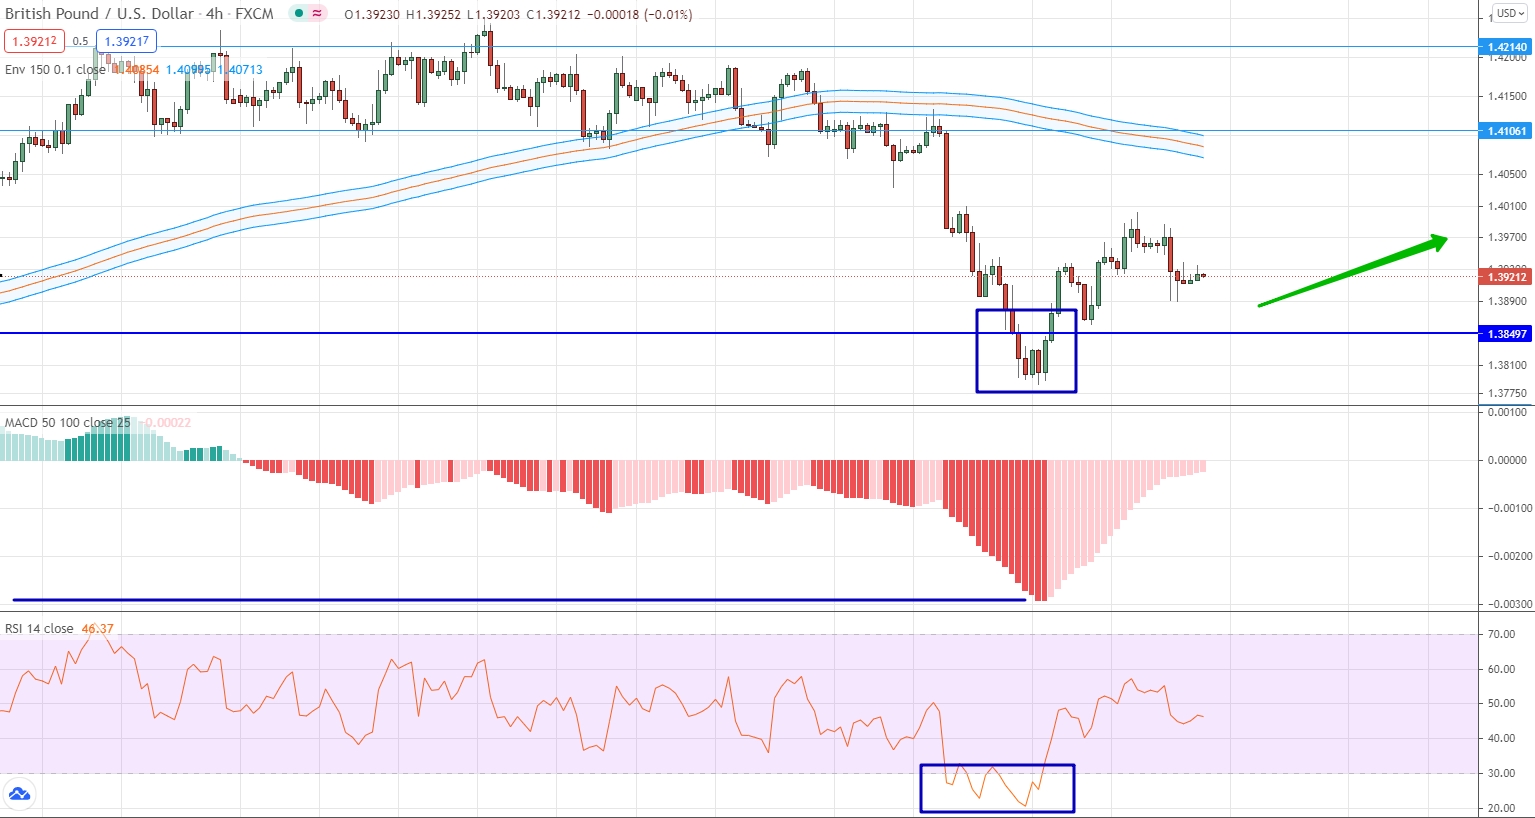
The British pound against the US dollar last week traded in different directions: at the beginning of the week there was a downward movement, after which the market turned around and began to move upward. Typically, the reversal and trend reversal occurred in the area of the important level of 1.3850. It is important to note that at about the same level the oscillator found itself in the oversold area, and the histogram tested its minimum values for more than a few months. You can consider trading options for a rise, and the optimal entry point will be close to the level indicated above.
USD/JPY
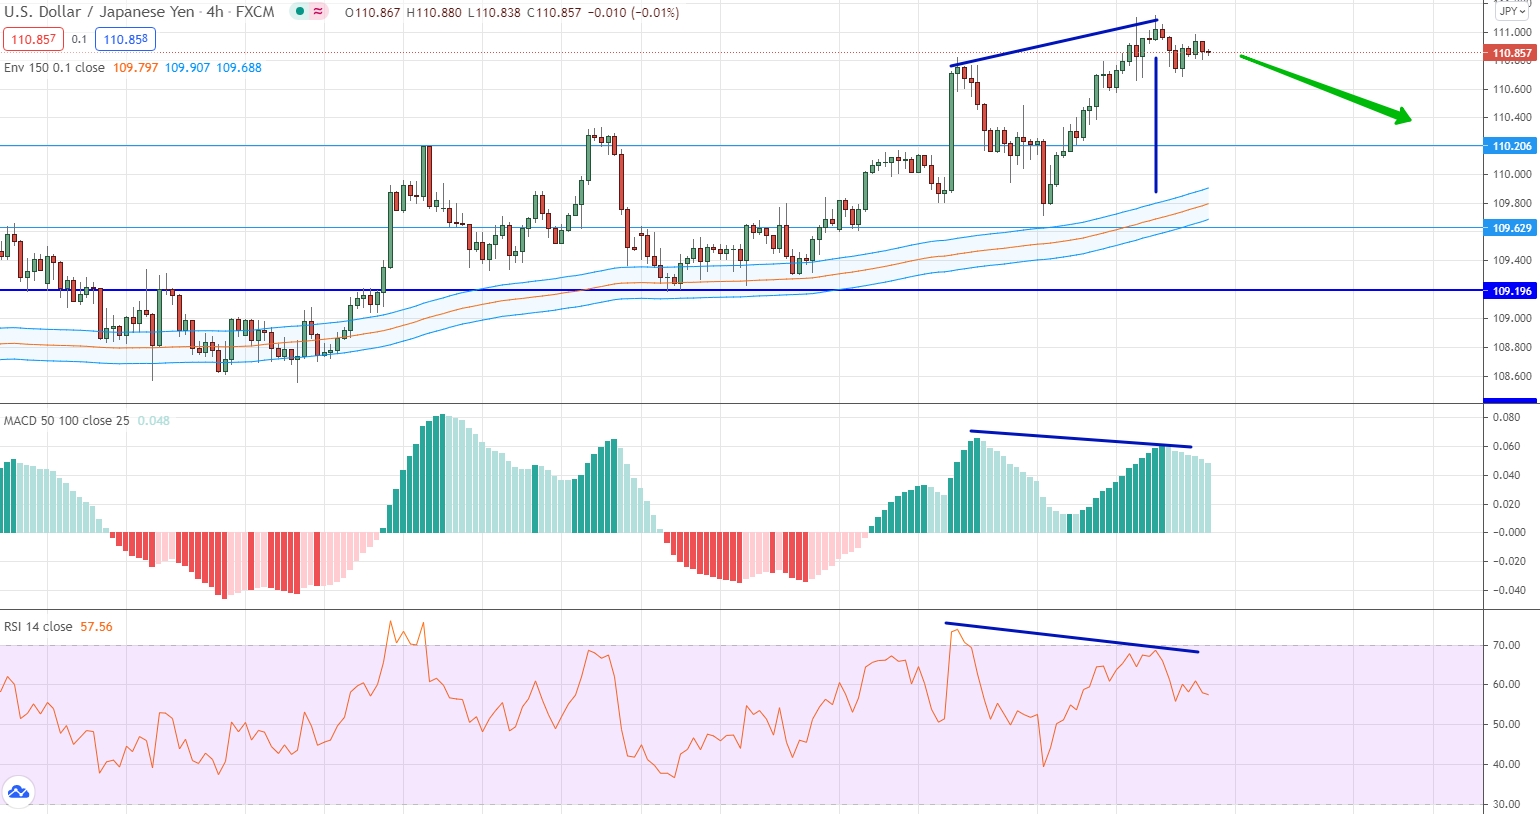
The dollar against the Japanese yen last week made a forward movement upward, continuing the upward trend. The current movement is interesting in that it leads to divergence between the price and all indicators, as the price rises and the indicators look down. We also take into account that the price has significantly moved away from the moving averages. In the aggregate of factors, you can consider options for trading a fall.
AUD/USD
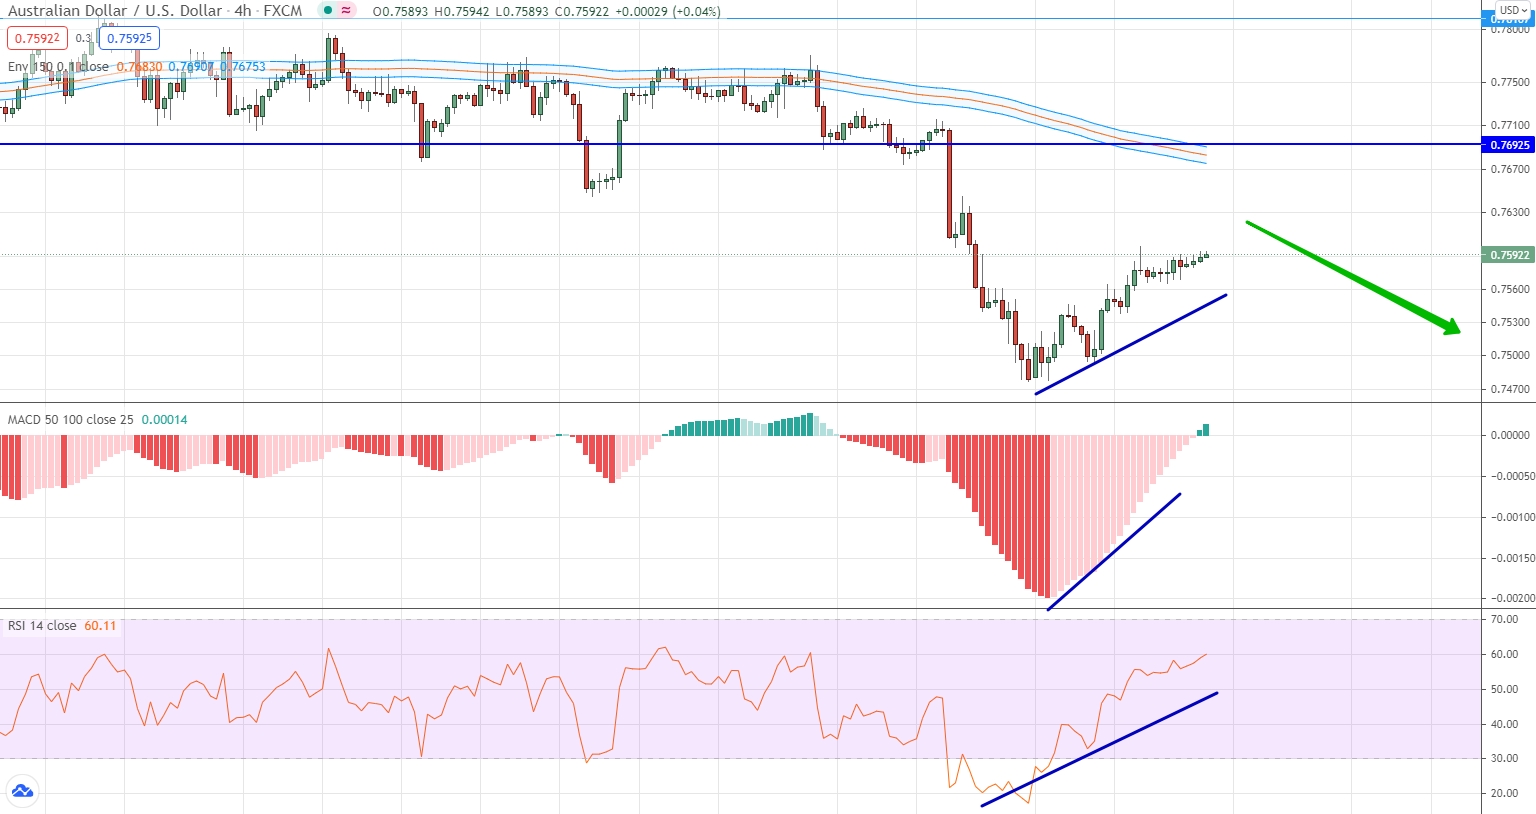
The past week led to an upward movement of the Australian dollar against the US dollar, only at the same time it is very important to note that globally a downward trend prevails for this currency pair, which means that the past week is corrective. An upward movement can be seen, among other things, by indicators, each of which is already in a positive area. Taking into account the fact that the price approached the moving averages, and the trend is mostly negative, we can consider trading options for a fall.
USD/CAD
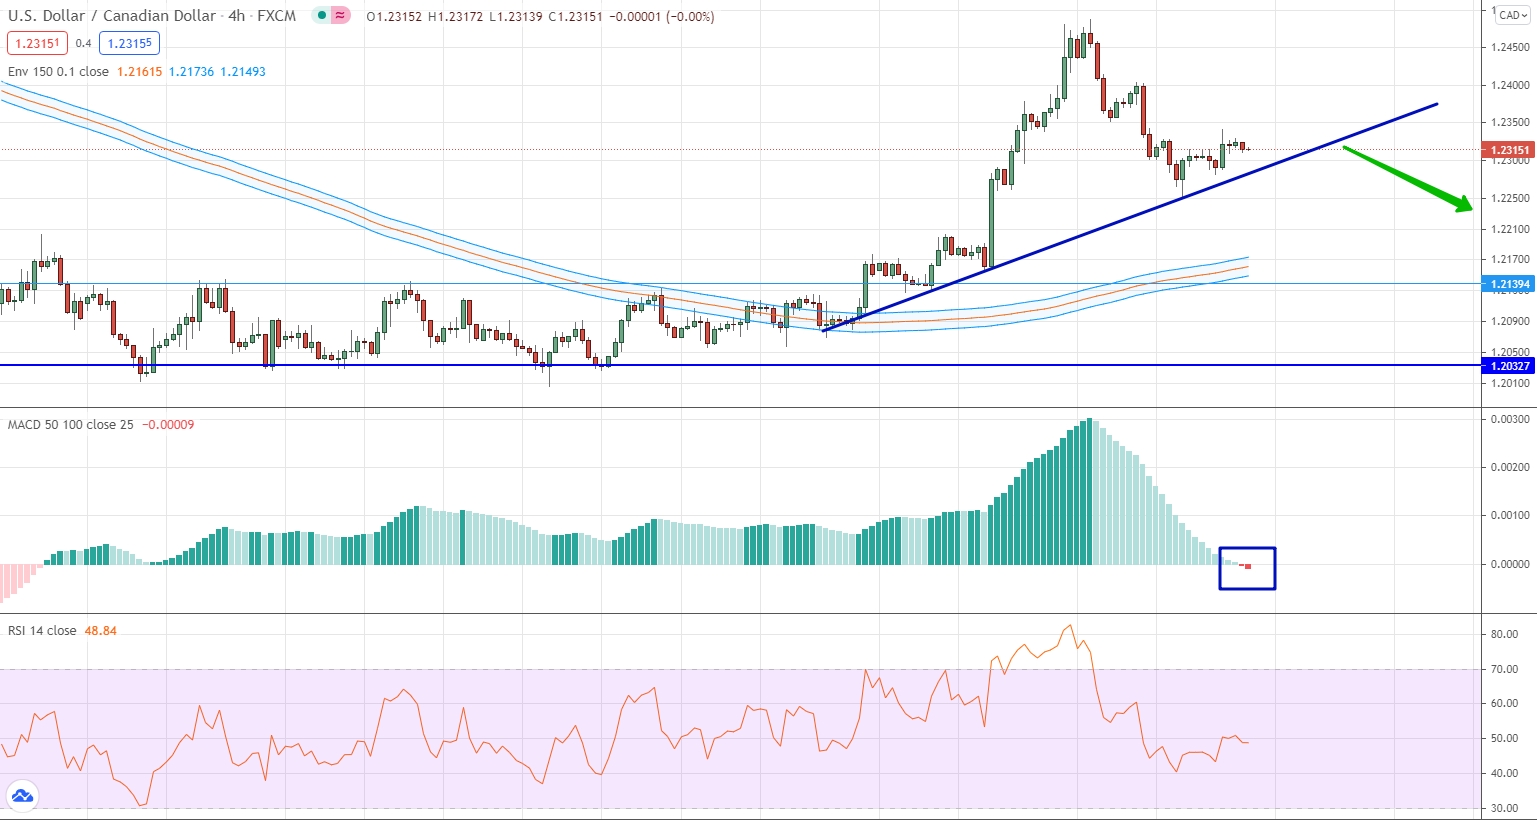
The US dollar against the Canadian dollar continues to form an upward trend, which is being formed after the exit from the sideways range, the significance of which we spoke about in the previous weekly reviews. The current situation allows us to draw an upward trend line, which confirms the current movement. Interestingly, for the first time in a very long time, the histogram turned out to be below 0. The oscillator is in neutral positions. Taking into account the totality of the factors of the indicators' positions, as well as the proximity of the price to the trend line, one can consider options for trading for a fall, but for this the price must necessarily break the trend line down.
USD/CHF
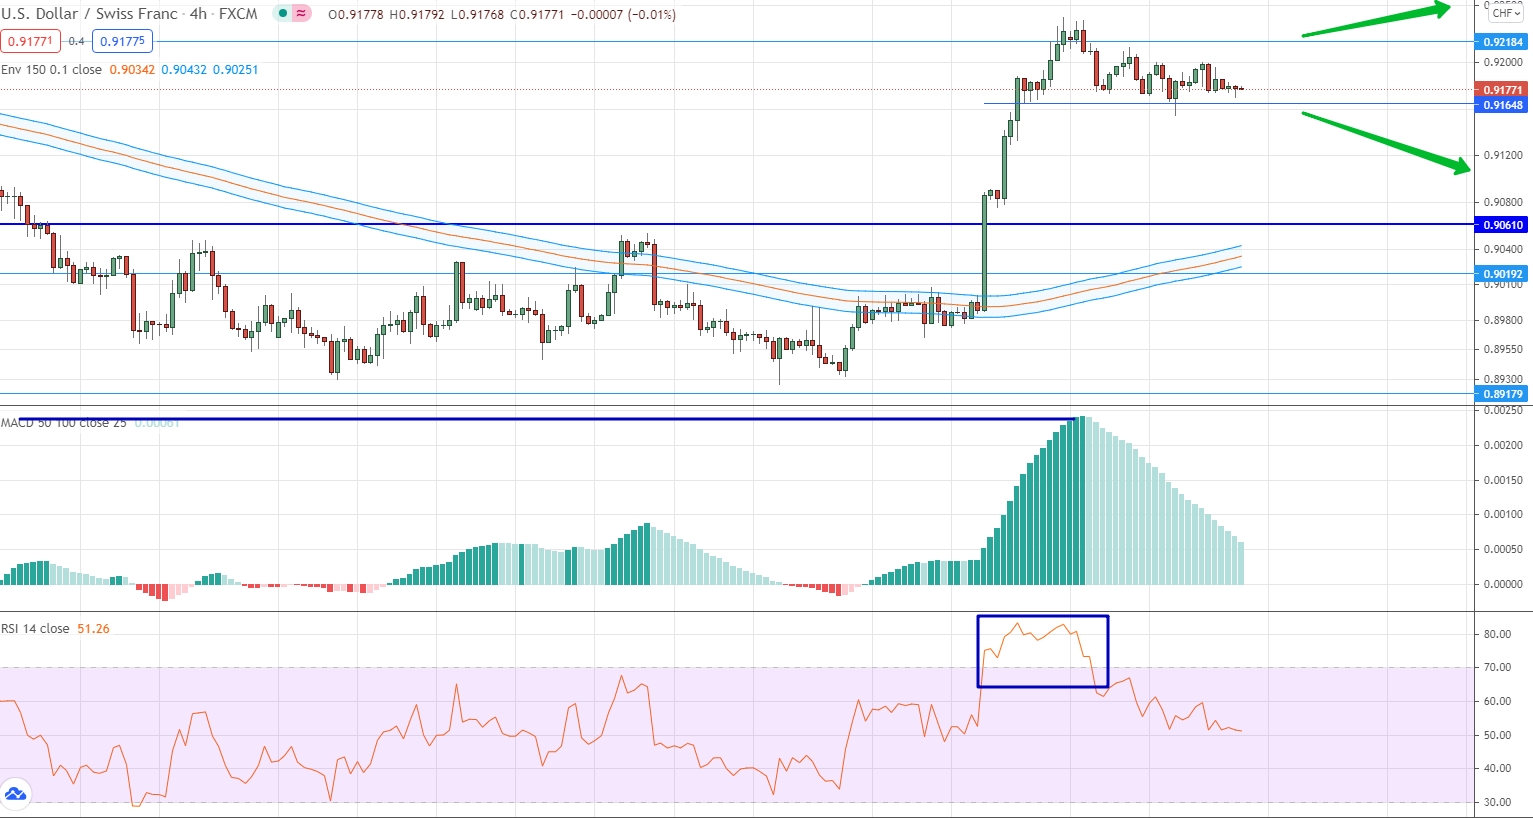
For this currency pair, a significant increase is observed, which within the last week allows the formation of a side corridor with the borders of 0.9218 and 0.9165. Typically, this range was formed at the moment when the histogram reached its maximum values for more than 3 months, and the oscillator rose to the overbought area. The only thing we can say now is that while the price is within the specified range, it is impossible to trade. We are waiting in which direction the range will be broken and open a contract in the direction of the breakout.
USD/RUB
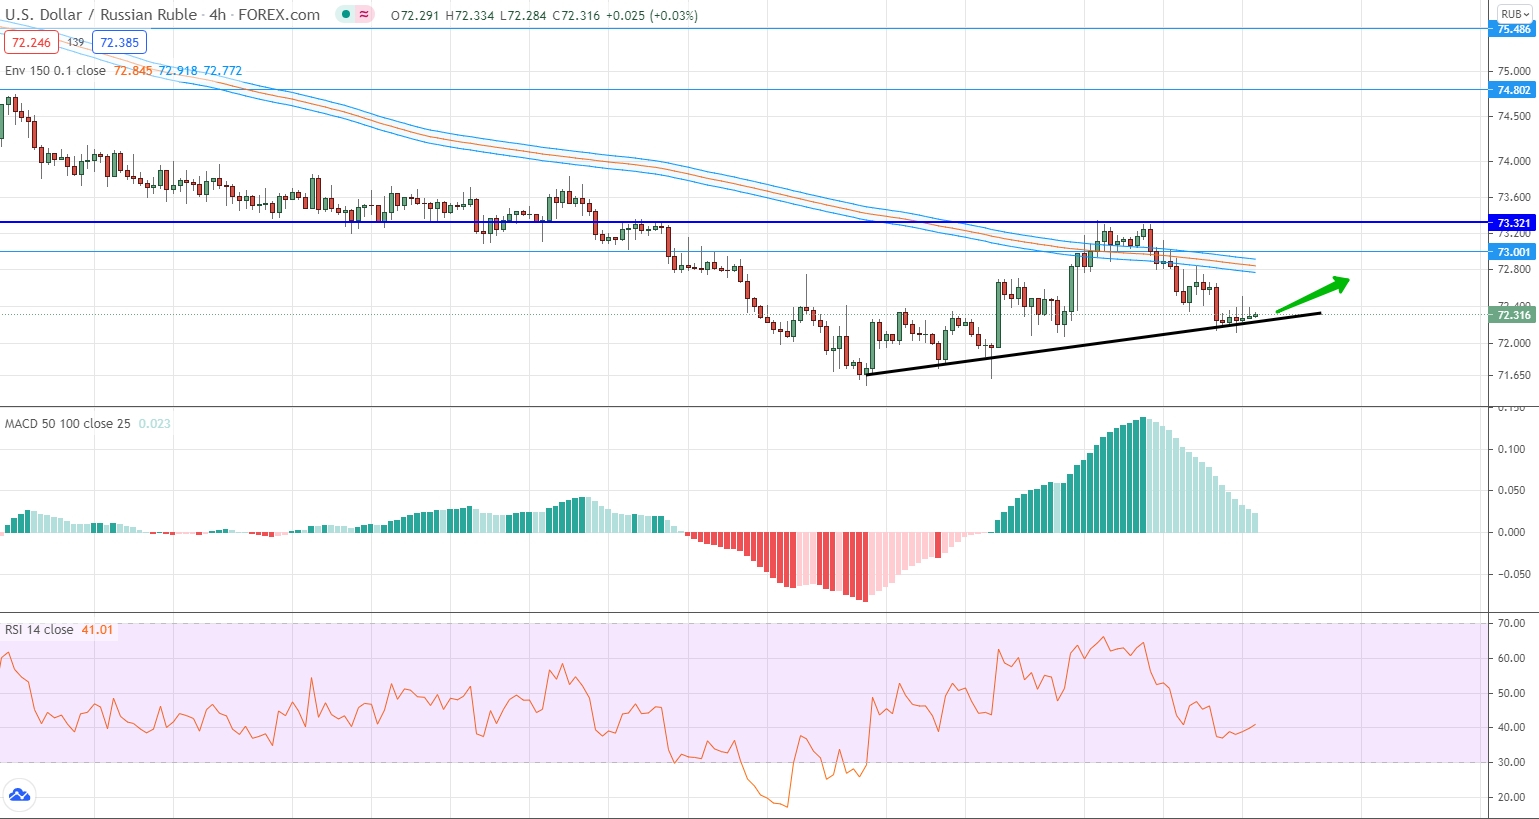
For the US dollar against the Russian ruble, a clear upward trend can be traced over the past weeks, which is trying to interrupt the downtrend. Nevertheless, the downtrend is still strong and this can be seen from the price chart, where the moving averages are reached. The indicators are in a neutral position and do not give specific signals for trading. Nevertheless, an upward trend line is being traced, which means that options for trading upward can be considered. However, it is obvious that the movement will not be strong.
Gold
The price of gold continues to form a downtrend, within which the market has reached an important level for itself. In fact, we can now talk about the presence of a sideways range with the boundaries of 1791.260 and 1868.630. At the same time, indicators are in the negative area and confirm the significance of the downtrend. However, the market does not give specific signals for trading here and now. Therefore, we wait for the price to go beyond the designated range and open a contract in the direction of this exit.


