


The Basics of Technical Analysis

An Introduction to Technical Analysis
Technical analysis is becoming an increasingly popular approach to trading, thanks in part to the advancement in charting packages and trading platforms. However, for a novice trader, understanding technical analysis – and how it can help predict trends in the market - can be daunting and challenging.
Technical analysis is the study of price movements in a market, whereby traders make use of historic chart patterns and indicators to predict future trends in the market. It is a visual representation of the past and present performance of a market and allows the trader to use this information in the form of price action, indicators and patterns to guide and inform future trends before entering a trade.
This technical analysis beginners guide will introduce you to the basics of this trading approach, and how it can be used to trade the financial markets.
Understanding Technical Analysis
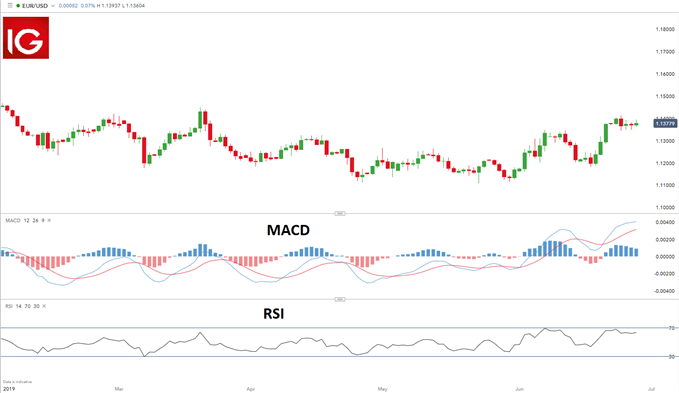
Technical analysis involves the interpretation of patterns from charts. Trader’s make use of historic data, based primarily on price and volume and use this information to identify trading opportunities based on common patterns in the market. Different indicators are applied to charts to determine entry and exit points for traders to maximize a trades potential at good risk-reward ratios.
The below chart is an example of a chart with the use of the MACD and RSI indicator.
While advocates of fundamental analysis believe that economic factors are the main contributors to movements in the markets, technical analysis traders maintain that past trends can assist in predicting future price movements. Although these trading styles can vary, understanding the differences between fundamental and technical analysis – and how to combine them - can be extremely beneficial.
Learn more about combining fundamental and technical analysis
How Technical Analysis can help traders
Many traders have found technical analysis to be a useful tool for risk-management, which can be a key stumbling block. Once a trader understands the concepts and principles of technical analysis, it can be applied to any market, making it a flexible analytical tool. Where fundamental analysis looks to identify intrinsic value in a market, technical analysis looks to identify trends, which conveniently can be caused by the underlying fundamentals.
Benefits of using technical analysis include the following:
- Can be applied to any market using any timeframe
- Technical analysis can be used as a standalone method
- Allows traders to identify trends in the market
Using Charts in Technical Analysis
The below chart is an example of a candlestick chart for the EUR/USD currency pair.
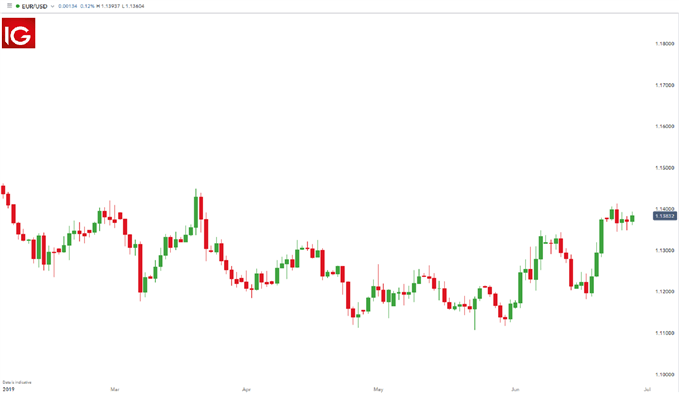
Charts are key to technical analysis. This is because the most important measure of a market’s past and current performance is the price itself; this is the starting point when delving into analyzing the potential of a trade. Price action can be represented on a chart as this is the clearest indication of what the price is doing.
Charts assist in determining the overall trend, whether there's an upward or downward trend, either over the long or short term or to identify range bound conditions. The most common types of technical analysis charts are line charts, bar charts and candlestick charts.
When using a bar or candlestick chart each period will give the technical analyst information on the price from where it opened, the high or low of the period as well as the close. Candlestick analysis is especially useful as the patterns and relationship within them can assist in making forecasts about the future direction of the price.
Once a trader has mastered the basics of charting, they can then make use of indicators to assist in determining the trend.
Technical Analysis Indicators
Indicators are used by technical traders when looking for opportunities in the market. Although many indicators exist, traders often make use of volume and priced-based indicators. These assist in determining where the levels of support and resistance are, how often they are maintained or breached as well ascertaining the length of a trend.
A trader can view the price or any other indicator using multiple time frame analysis, ranging from one second to a month which gives the trader a different perspective of the price action.
The more popular indicators for technical analysis include:
- Moving Averages
- Relative strength index (RSI)
- Moving average convergence divergence (MACD)
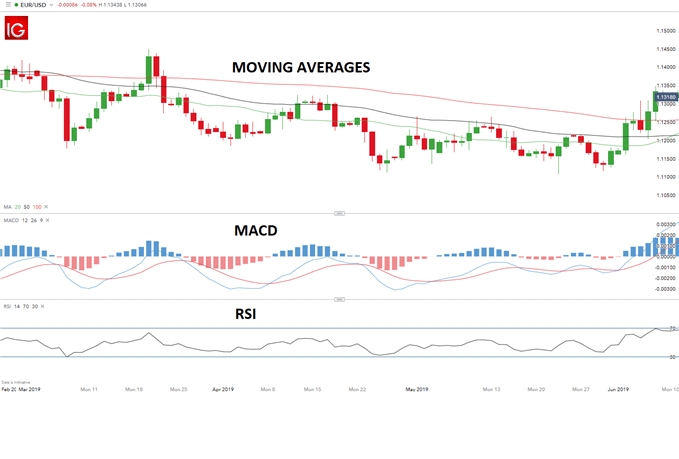
The EUR/USD chart below shows how to make use of different indicators.
Moving averages and MACD are often used to identify trends in the market while the RSI is typically used to determine possible entry and exit points. Indicators assist traders in analyzing the market, validating trade set ups and determining entry points.
Learn More about Technical Analysis
- Review the three most common types of technical analysis charts to compare techniques.
- Bookmark our technical analysis news feed to stay up to date with the latest insights on current market trends.
- Join our in-house experts as they explore the main issues affecting trades in the live daily webinars.
- Look at what makes a trader successful in the Traits of Successful Traders manual.
- Learn the basics of Forex technical analysis and the benefits of applying it in trading
Information source - DailyFX.com
