Ichimoku cloud trading strategies

The Ichimoku Cloud is a multifaceted practical analysis indicator we also call 'Ichimoku.' It is based on a Japanese candlestick chart aimed at predicting potential price actions. The principle behind the Ichimoku Cloud trading strategy is to employ a Moving-Average (MA) based trend indicator that indicates the probable direction of stocks. It is a crucial tool to spot bearings and momentums, which helps traders and investors in making every day buying and selling decisions more quickly. A Japanese Journalist known as 'Goichi Hosoda' created this tool in the 1930s. The brainwave behind this development was that Ichimoku Cloud would be a tool that can merge several strategies but, at the same time, is plotted as one indicator on a chart.
Ichimoku Cloud is also known as 'Ichimoku Kinko Hyo' (which the Japanese translate to mean 'a one-look equilibrium chart'). This indicator helps traders to single out high-quality trading opportunities in a competitive market.
Goichi Hosoda decided to release the indicator to the public mainstream in the 1960s after thirty years of working on perfecting it. Since its release, Ichimoku Cloud has been one of the most fashionable indicators for investors and traders of all types. Despite being one of the most versatile and comprehensive indicators, it remains mostly a momentum-based instrument for technical analysis. The Ichimoku Cloud is similar to other popular indicators such as Moving Average and Bolinger bands.
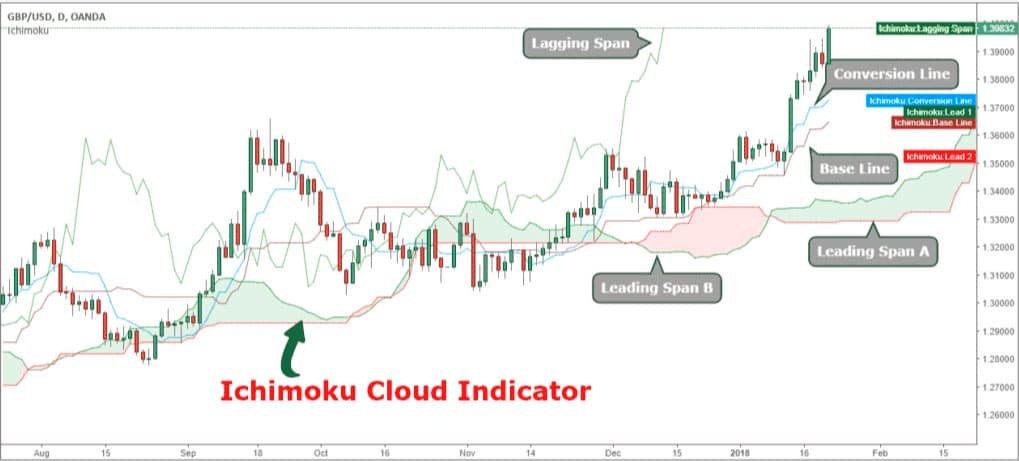
Ichimoku Cloud, as a technical analysis tool, can be explained with five lines computed as:
- 'Tenkan Sen', which is also known as the Conversion Line, with the red color. It is usually plotted as a moving average of the midpoints of the precedent 9 periods.
- 'Kijun Sen' known as the Base Line, usually in white, and is often plotted as a moving average of the midpoints of the past 26 time periods.
- 'Senkou Span A' is yellow and is plotted as the midpoint of Tenkan Sen (conversation line) and Kijun Sen (Base Line) with the line anticipated 26 time periods into the future.
- 'Senkou Span B' is blue and plotted as a moving average of the midpoints of the last 52 periods. The line projected 26 time periods into the future.
- 'Chikou Span' is often in green color. It is the present closing price that is plotted 26 time periods back.
-
Once there is an identification of a Leading Span' A' and 'B' have, then the cloud component of the graph is shaded in. If the Leading Span' B' is above Leading Span 'A,' it means that the price thrust is currently on the increase; hence, the graph is shaded green.
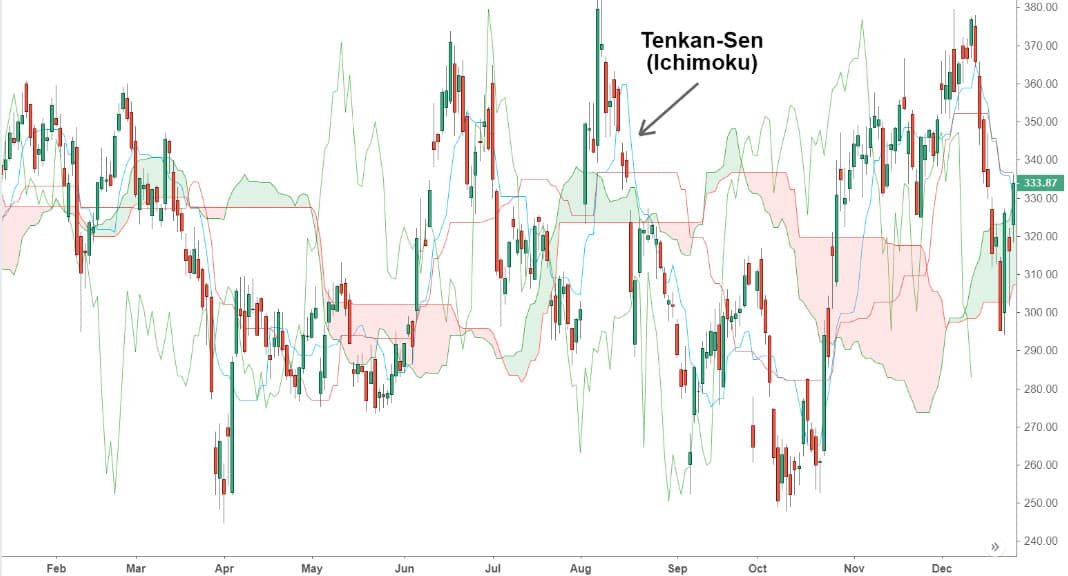
Ichimoku conversion line
Ichimoku Conversion Line or Tenkan-Sen is the borderline of the highest and lowest prices of an asset over the previous 9 periods. The Conversion Line usually follows the price carefully, which aids in identifying short term price direction using its slope. In the cloud indicator, the Conversion Line is the fastest moving line.
We express the Formula for Ichimoku Conversion Line is as follows:
(9+9)/2 which means (9 high periods + 9 Low periods)/2
- The Tenkan-Sen is typically not used on its own; it is preferably in combination with other elements of the Ichimoku Cloud indicator. For instance, if the Conversion Line moves above the Base Line, which is always the 26-period price midpoint, some traders/investors sight it as a buy signal. On the other hand, when the Conversion Line drops below the Base Line, the reverse is the case. Also, when the price is above the cloud, traders/investors may opt to buy when the Conversion Line crosses above the Base Line. When the price is below the cloud, investors/traders may as well sell when the Conversion Line drops below the Base Line.
- The Tenkan-Sen also plays a role in generating Senkou Span A, one of two lines creating the "cloud" on the Ichimoku indicator. The edges of the cloud indicate support and resistance points, and the thickness of the cloud indicates price volatility.
-

Ichimoku indicator
The Ichimoku indicator, or Ichimoku Kinko Hyo, is a flexible all-in-one indicator that defines information about support and resistance. It shows the trend in direction, measures momentum as well as provides a trading indicator. The Ichimoku indicator is a powerful trading instrument, even though traders/investors feel beleaguered when studying the lines and information that the index gives. The Ichimoku indicator consists of two indicators; The Bullish Indicator (which is the trend that exists when Senkou Span A rises above Senkou Span B). And, the Bearish Indicator (a trend that exists when Senkou Span A drops below Senkou Span B).
The Ichimoku indicator comprises of two crucial and different components, namely:
- The Ichimoku Cloud which is the trendiest feature of the indicator because of its outstanding quality;
- The Conversion Line and Base Line, which is similar to moving averages on the charts but differ in interpretation.

The Ichimoku Cloud
The Ichimoku Cloud consists of an upper and lower boundary with space between the two lines, which is usually shaded in green or red color. The first and faster-moving borderline of the cloud is the average between the Conversion Line and the Base Lines. The second and slower-moving boundary is the core amid the 52 periods high and low. The central characteristic of the cloud is that it is projected 26 periods to the future.
The cloud acts and interprets information, support/resistance, and also provides trends in direction and momentum. The cloud indicates an uptrend when the price is on top of the cloud and a downtrend when the price is below the cloud. Nevertheless, the cloud moves slower than the Conversion Line and Base Lines.
The Conversion Line and the Base Line
The Conversion Line and Base Lines look similar to moving averages on the chart but works differently. The Conversion and the Base Lines look back to 9 and 26 periods high and low and acquire the highest and the lowest price altitude during the period under consideration. Consequently, it plots its line in the central point of that range. The Conversion Line and Base Lines depend on two rationales, namely: acting as support and resistance during trends (similar to moving averages) and gauging momentum information. Whenever the price is trading above the two lines, and the Conversion Line is above the Base Line, it indicates bullish momentum just as what we obtain in moving averages. However, when the shorter moving average crosses above, the longer moving average, it shows that momentum is on the rise.
Ichimoku cloud day trading
Centering on short-term trading requires an eye for a few vital considerations. These include the knowledge that cloud management might make or smash your trading and that immediately momentum expires, your trade interest expires too. That cloud day trading can be defined by the price riding the cloud. Since several lines on the Ichimoku Cloud chart are formed using averages, this makes the chart much similar to moving average but not entirely the same. Ichimoku cloud is more self-motivated than a simple moving average chart because it is designed to define changes in support and resistance, as well as provide trend in momentum.
The Ichimoku Cloud is one of the most useful tools for day traders and for making quick decisions in the market. The cloud is habitually combined with other technical indicators like the Relative Strength Index (RSI) for traders/investors to get an accurate picture of the level of resistance and support. Many other traders/investors watch out for crossovers in their aim to identify when the trends reversed. The correlation between 'Leading Span A' and 'Leading Span B' usually indicates whether there is an ongoing downtrend or uptrend. At the same time, proper consideration is given to both colors and the size of the cloud.
To identify the right swing with the tendency of boosting your profit during Ichimoku cloud day trading, we recommend that chartists wait until the price breaks and closes above the Ichimoku Cloud. Do wait for the Conversion Line to cross above the Base Line, buy at the opening of the next candle. Traders should position protective stop loss below the breakout candle and take profit when the Conversion Line drops below the Base Line.
Ichimoku 5 minutes strategy
Ichimoku is a vibrant tool that can be applied to numerous time frames effectively and efficiently. Note that irrespective of whatever time frame you utilize Ichimoku to, it can help one see when a trend is prone to continue. Also, it helps recognize a reasonable price to enter the market based on when price and the lagging line is bound to break through the cloud or price crosses the Base Line.
Logically, we advise that when trading with Ichimoku, especially on a 5 minutes strategy, one should start with the cloud. The cloud works to keep the odds in your favor while trading with a perception that the trend will most likely persist. Aside from the cloud, the other critical aspects of Ichimoku one should focus on are the lagging line and the Base Line. The lagging line is perceived to be the momentum indicator. When the line breaks upward or downward, it becomes and authentication to join the day's trend. The Base Line, on the other hand, is the crossover of price in the direction of the overall trend. The Ichimoku Strategy is one of the most sorts after technical analysis tools because of its good strategy of identifying trends and profit from trading any market on any time frame.
Conclusion
Out here on the internet and elsewhere, there seems to be a good number of resources about indicators and trading strategies many western traders favor. On the other hand, the Eastern traders, including the Japanese, find the Ichimoku Cloud trading strategy fascinating. The Kumo cloud is an exceptional standalone tool that is entirely customizable --You are never in need of other tools if you are a Kumo trader. A trader can always get rid of some of its components as suited by their trading method.


