Forex Weekly Forecast & FX Analysis July 05 - 09

EUR/USD
The euro against the dollar last week made a slight, but rather important downward movement, as the price turned out to be below the level of 1.1863. It is very important to note that the movement is not visible on the histogram, since the indicators are near the zero line. If we consider the oscillator, then it forms a divergence together with the price. Therefore, we can expect the market to move up to the 1.1900 level. Therefore, we are considering the possibility of trading up.

GBP/USD
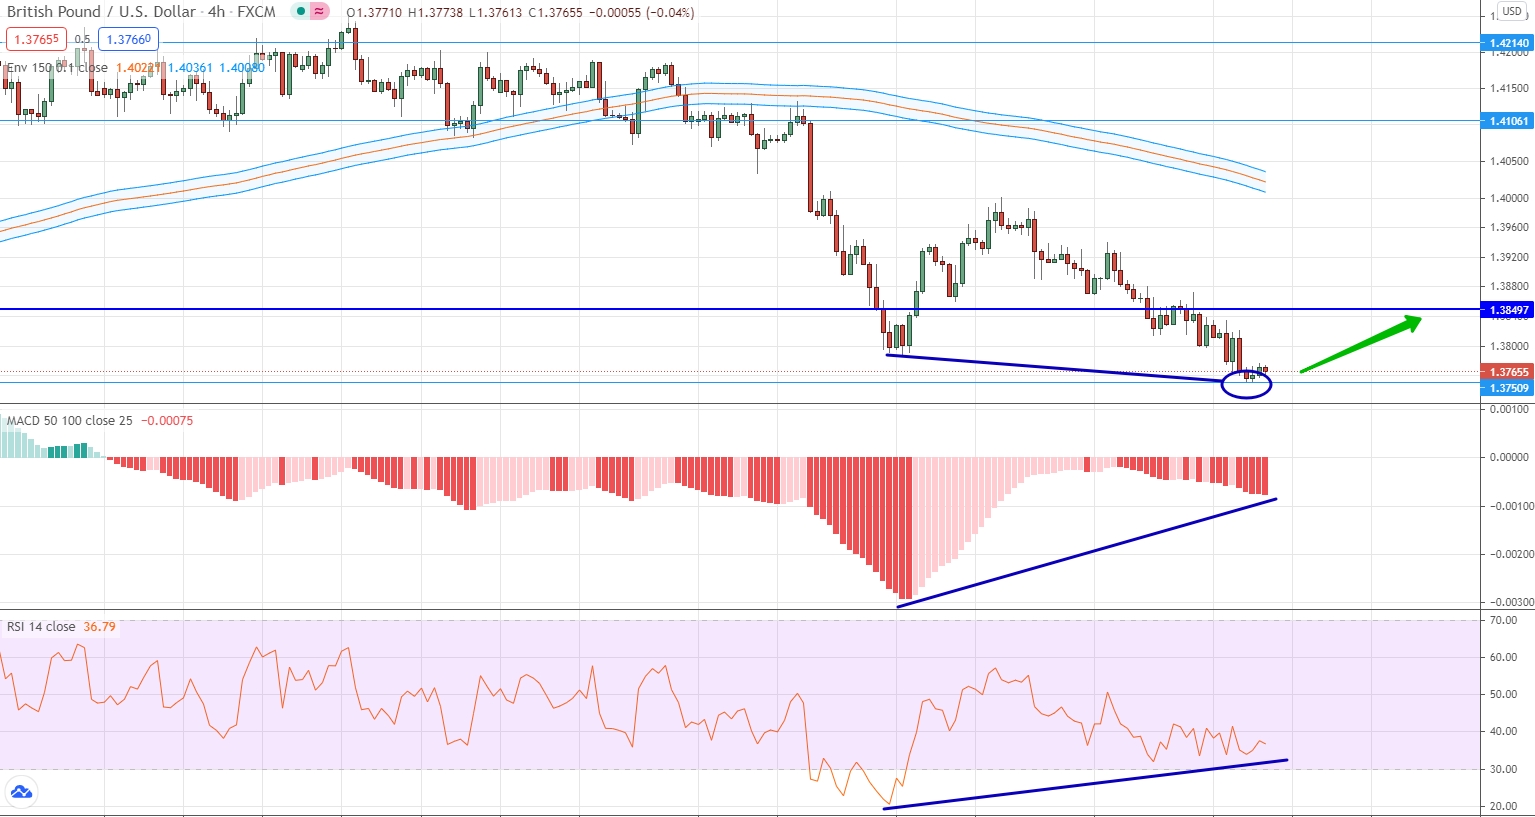
The British pound against the US dollar continues to form an active stage of the downward movement. The past week led to a fairly strong downward movement, as a result of which the price was in the area of the 1.3751 level. The most important characteristic of the current market segment is the presence of divergence between the price and all indicators. After all, the market goes down, updating the minimum values for itself, while the indicators look up and approach zero values. Therefore, taking into account a combination of factors, we can consider options for trading up.
USD/JPY
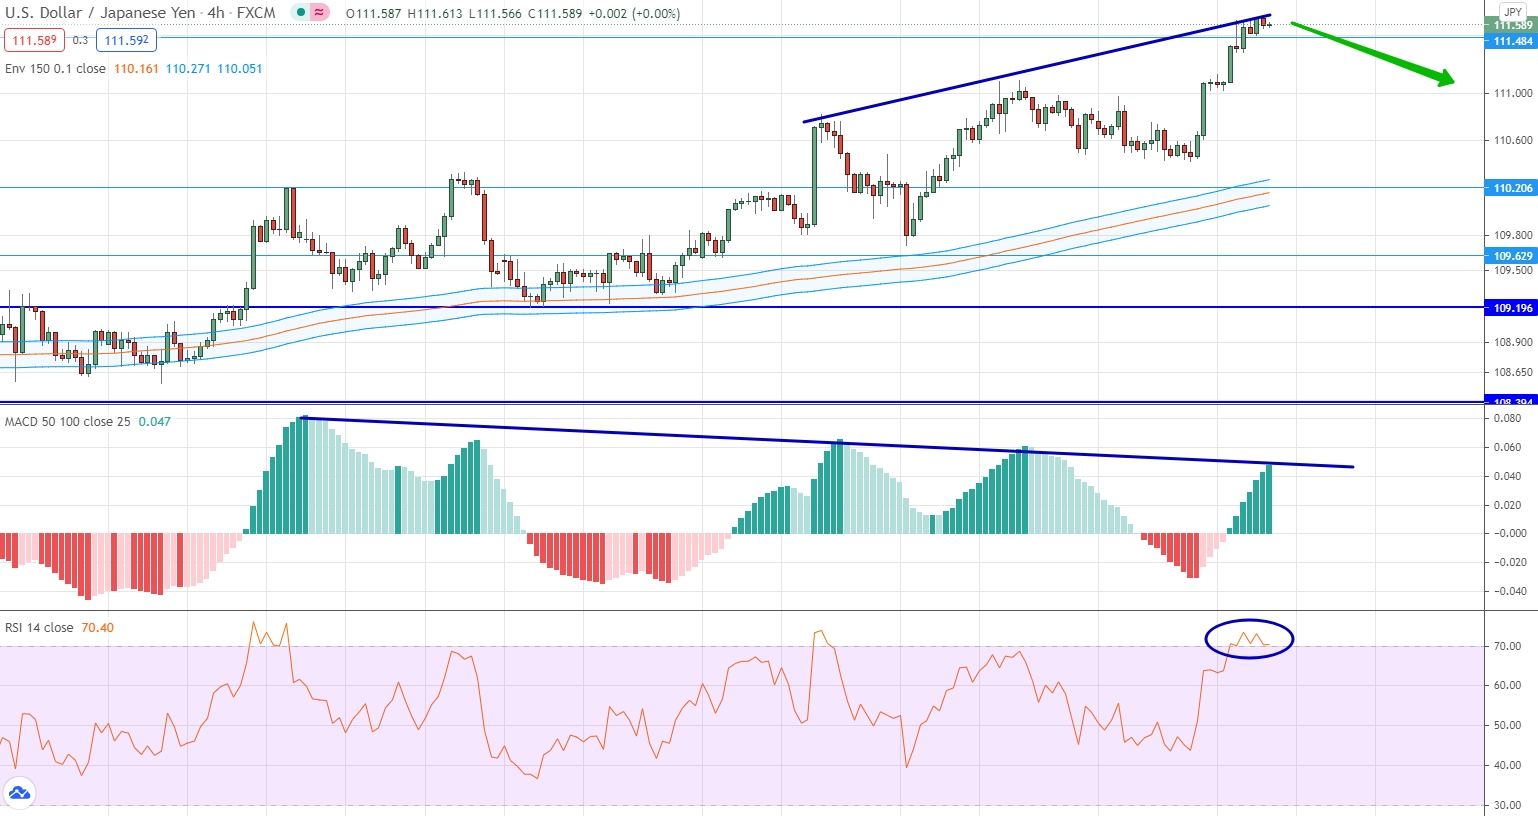
The past week led to a fairly strong upward movement of the US dollar against the Japanese yen. As a result of this movement, the market was above the level of 111.485, and the oscillator was in the overbought area. An important characteristic of the current market segment is provided by the histogram, since it has been looking down for a long time and thus comes into conflict with the price. Therefore, we are talking about the presence of divergence. Together with the approach of the price to an important level, it gives the main signal for trading for the coming week. We are considering the possibility of opening a contract for a fall.
AUD/USD
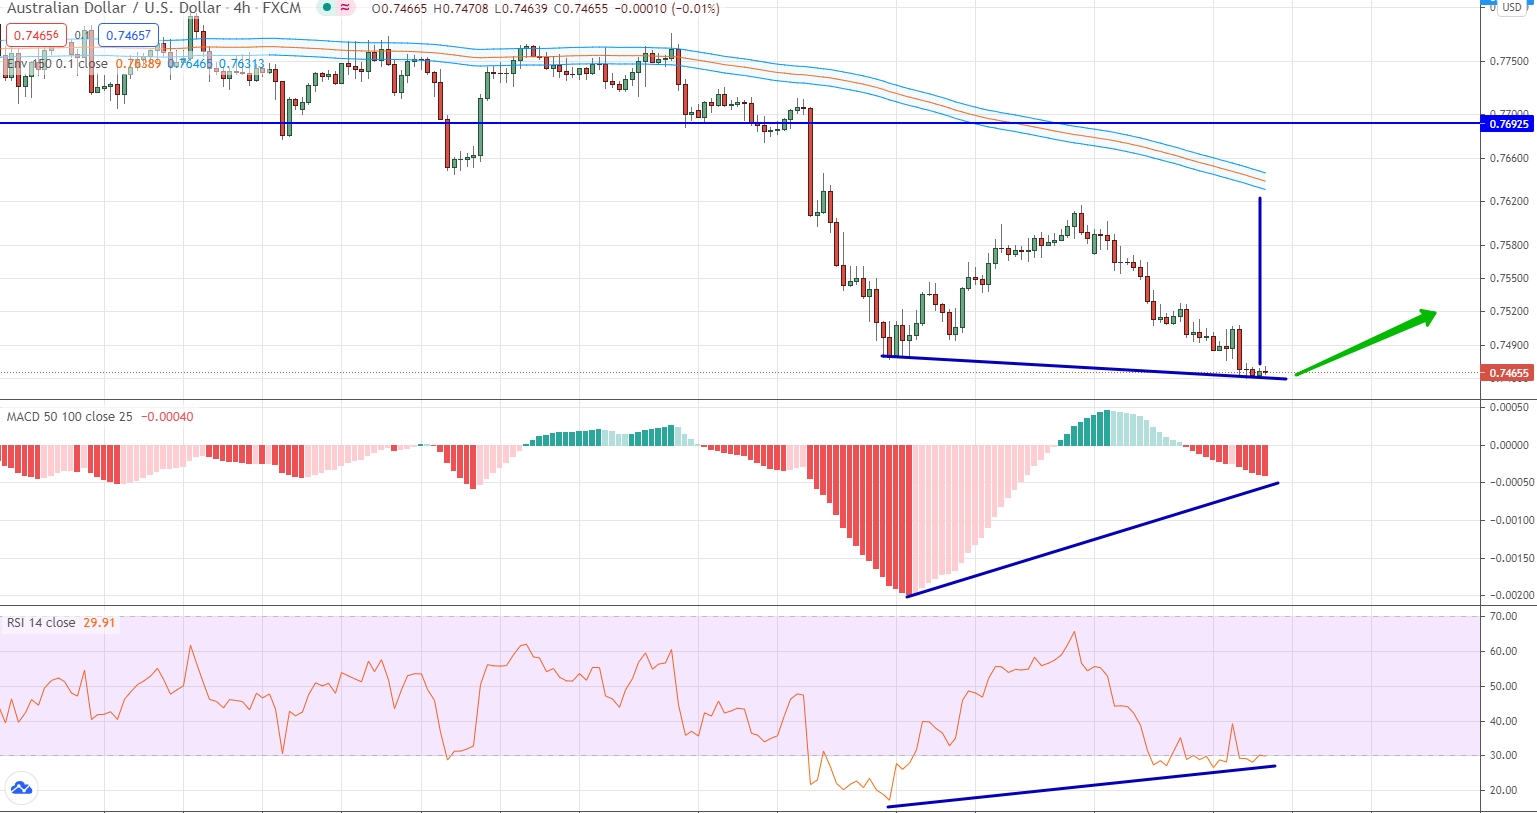
The Australian dollar continues to form a downtrend against the US dollar and renew its minimum values. At the same time, this currency pair is the next one within the framework of this weekly review, according to which we state the fact of the presence of divergence between the price and all indicators. In this case, both the oscillator and the histogram look up, while the market moves down. It is also important to note that the price has already moved very far from the level of the moving averages. On the basis of a combination of factors, we consider the possibility of trading up, but taking into account that we are working against the market.
USD/CAD
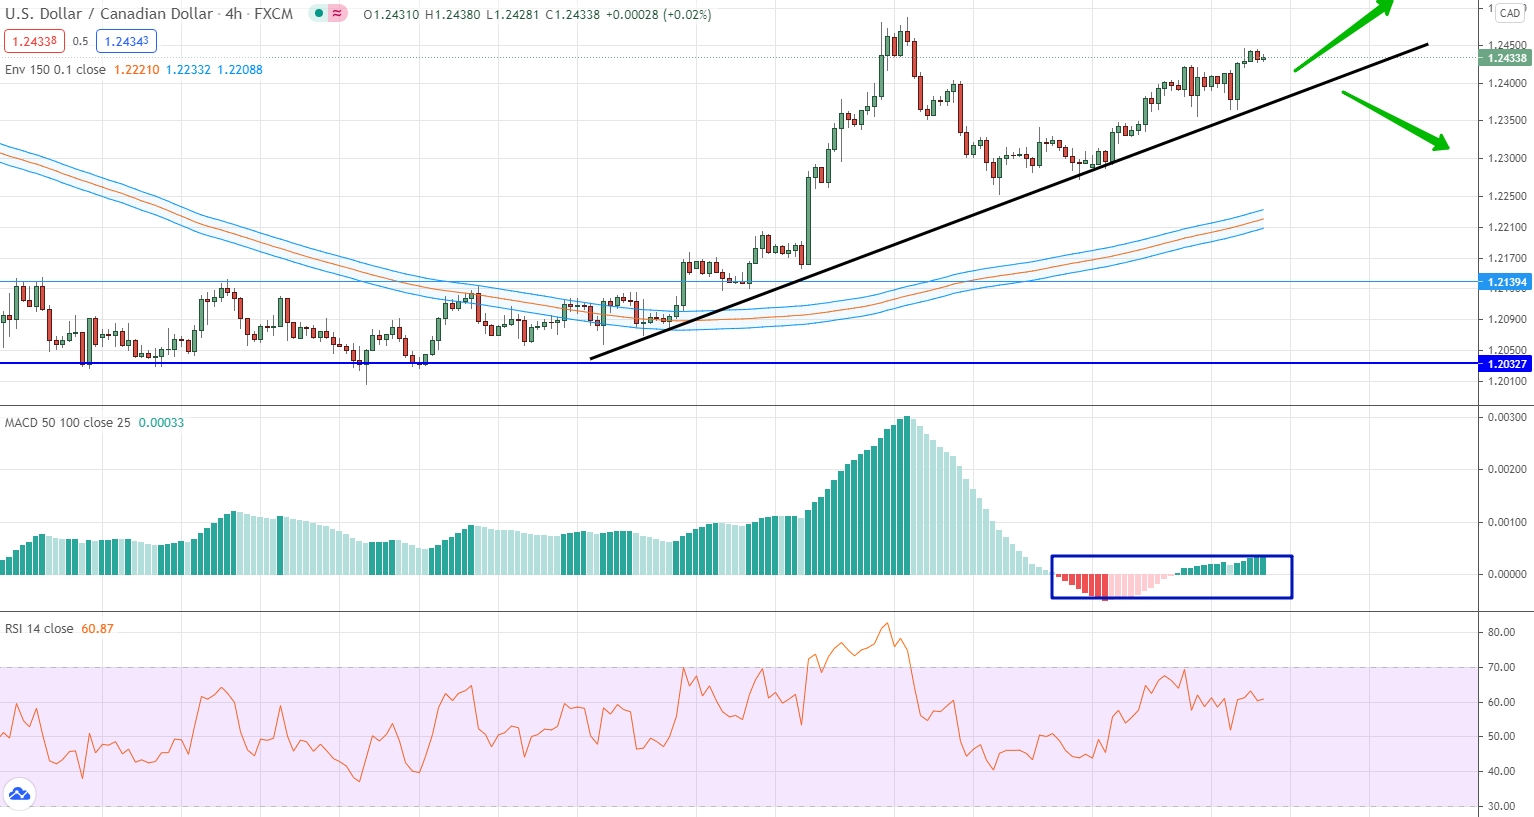
This currency pair continues to form an upward trend, which originated at the moment the price exited above the price channel with the upper border at 1.2140. Now we are stating the fact of the presence of weak volatility, which is confirmed both on the price chart and on the indicators. The indicators literally stuck to zero values, but the price chart still moves up in insignificant steps. Therefore, we can only consider bull trading options. A downtrend will only be possible if the price falls below the trendline.
USD/CHF
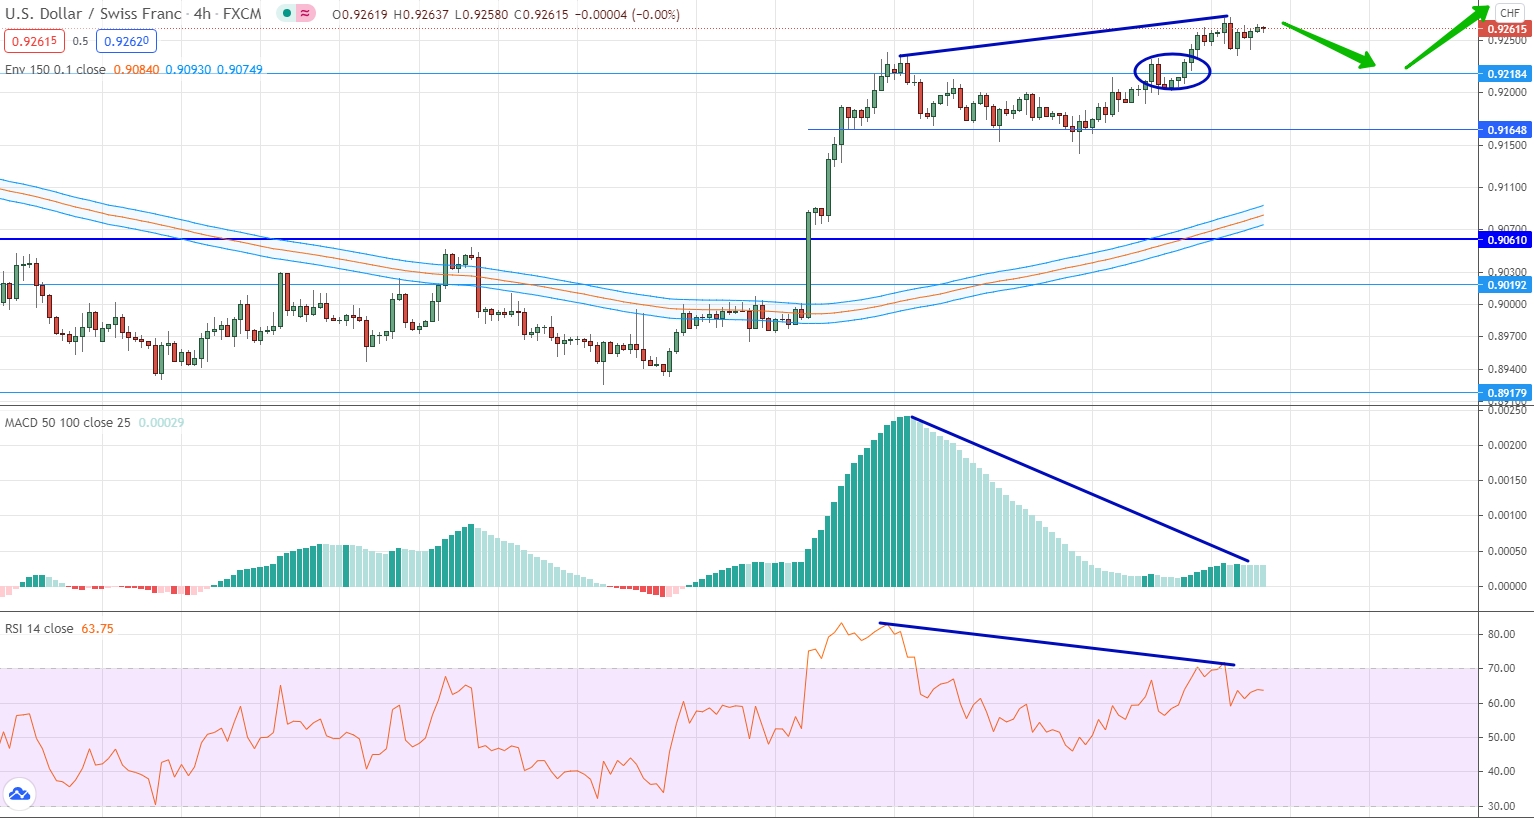
The lateral range, which we talked about in the previous weekly review of the US dollar against the Swiss franc, was broken in the direction of growth, after which an upward movement really began. It is very important to note that this upward movement led to the formation of divergence between the price chart and all indicators. The best solution in this situation would be to expect the market to test the important level of 0.9218 again, and then go into the growth stage.
USD/RUB
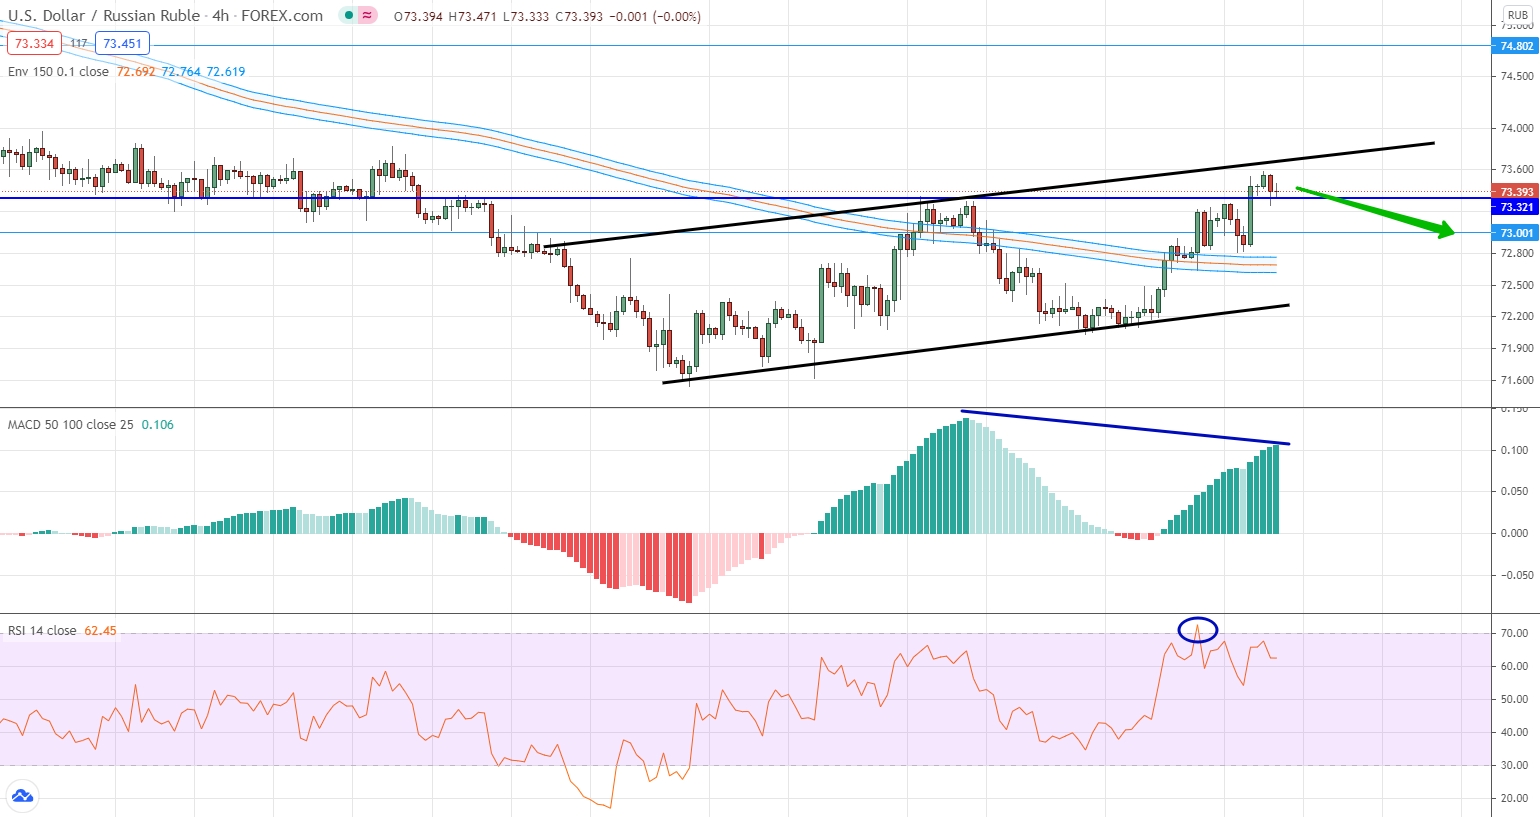
The US dollar is gradually winning back its positions against the Russian ruble. For the current section of the market, we can draw an ascending channel and note the fact that the price has already consolidated above the moving averages and is making an attempt to consolidate above the very important level of 73.32. At the same time, we are again talking about the fact that there is a divergence for the currency pair. In this case, the market is growing, while the histogram is looking down. It is very important that at the same time on the price chart the value of the currency pair is in the area of the upper border of the price channel. Therefore, there is every reason for a downward movement.
Gold
Gold prices are still recovering from strong sales in recent weeks. The current market situation allows for a side channel with the boundaries of 1790.834 and 1766.215. Last week the market tried to break through this price channel in a downward direction, but the price very quickly returned to its borders. Therefore, now we can say that while the market is within this range, it is impossible to trade. We are waiting in which direction the range will be broken and open a contract in the direction of the breakdown.


