Price Action in Forex – Basic Guide for Beginners

- What is Price Action in Forex?
- Price Action Candlesticks & How to Read Them
- What Are Price Action Trends & How to Determine Them?
- What Are the Price Action Patterns?
- Top 11 Price Action Trading Strategies for All Traders
- Strategy 1 – Trendline Trading Strategy
- Strategy 2 – Trendline Breakout Forex Trading Strategy
- Strategy 3 – Support and Resistance Forex Trading Strategy
- Strategy 4 – Support Level Breakout Forex Trading Strategy
- Strategy 5 – Resistance Level Breakout Price Action Forex Trading Strategy
- Strategy 6 – Trading Strategy for All Timeframes
- Rules of Trading Strategy for All Timeframes
- Strategy 7 – Daily Pin Bar Price Action Forex Trading Strategy
- Strategy 8 – 123 Forex Price Action Trading Strategy
- Strategy 9 – Railway Tracks Chart Pattern Price Action Forex Trading Strategy
- Strategy 10 – Multi-Timeframe & 123 Forex Trading Strategy
- 4-HOUR CHART
- 15-MINUTE CHART
- 5 MINUTE CHART
- How to Manage Price Action Forex Risks?
- Conclusion
What is Price Action in Forex?
The movement of security price plotted over time is called price action in Forex trading. This movement is analyzed with regard to price changes in the recent past. To be more precise, price action is a Forex discipline that allows traders to analyze the market and make decisions based on the actual and recent price movements instead of relying entirely on technical indicators. The primary tool that most forex traders use for price action are charts of currency pairs and their patterns. Traders analyze these currency pair charts and predict future fluctuations.Price Action Candlesticks & How to Read Them
If you are a Forex trader, then you might be familiar with how crucial the candlesticks are. They are considered the core elements of charts. The candlestick comprises two parts:- Body;
- Shadow.
Modes of Candlesticks
Candlesticks in financial charts have three modes:- Bullish;
- Neutral;
- Bearish.
Traditional vs. New Representation of Candlesticks
As far as conventional financial charts are concerned, bullish candlesticks were represented as white, while the bearish ones were black. Nowadays, modern software uses different colors and allows traders to set them as per their requirements.What Are Price Action Trends & How to Determine Them?
Price action trends are the movements of the market within a specific period. The trend of the market can be ascending or descending. If there is a series of increasing maximums & minimums, then it is an ascending trend. While if there is a series of decreasing maximums or minimums, it is called a descending trend.Trend Breakout
Change of trend, either in ascending or descending manner, is called trend breakout. In an ascending trend, the price below the last minimum is a signal of the upcoming change of trend. While in a descending trend, the price below the previous maximum is the signal of change into an ascending one. This change is called a trend breakout.What is the Best Time to Enter the Price Action Trend?
In Forex, the best time to enter a trend is during the correction. Correction is the movement that is against the trend. You can also join the trade during consolidation. Consolidation is the flat movement of a price. Don’t ever try to enter while the price is at its peak.What Are the Price Action Patterns?
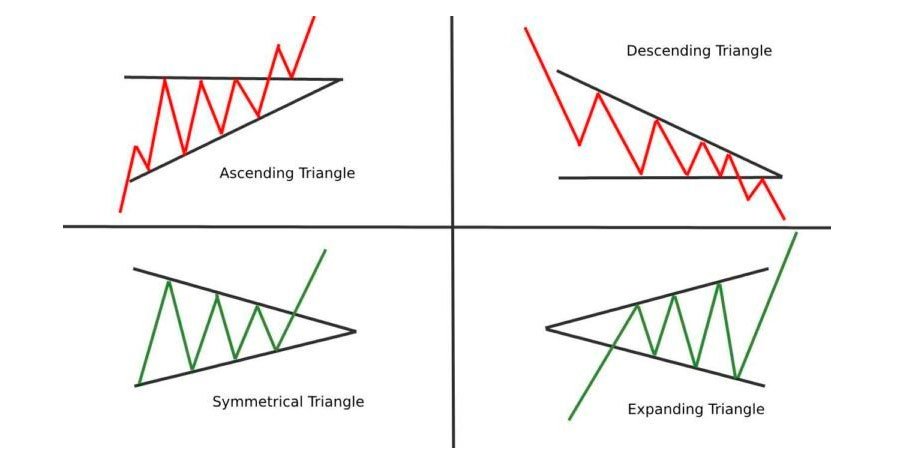
There are several chart patterns to describe. Let’s have a look at them one by one.Triangle
A triangle is formed when the resistance and support lines cross over. There are four different types of Forex price action triangles:- Ascending Triangle;
- Descending Triangle;
- Symmetrical Triangle;
- Expanding Triangle.
Flag
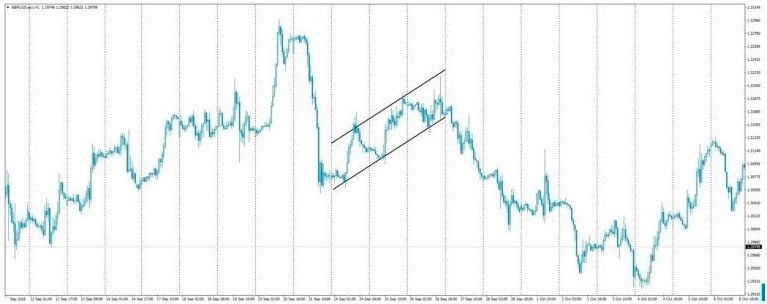
When the support and resistance lines move parallel to each other, it is known as the flag pattern. It can be:- Rectangular;
- Ascending;
- Descending.
Top 11 Price Action Trading Strategies for All Traders
Price action trading strategies help even beginners to trade safely with maximum profitable rates. Below, we are going to mention some of the best price action trading strategies for you.Strategy 1 – Trendline Trading Strategy
Trendline is one of the straightforward, simple, and easy-to-use price action strategies. The key to this strategy is the fact that “The stock price responds and bounces back to the trendlines.” So if you are familiar with how to draw stock trendlines, it will be easy for you to predict when the stock price will bounce back. You can easily trade based on that information. Simply make sure that when utilizing a trendline trading strategy, you must be well aware of drawing the trendlines. Another important note is that the more occasions a line is tried, the more well-suited it is to break, even when you are targeting for a short period of time. Likewise, it is very typical for a pattern line to break and afterward be retested from the opposite side. And if you observe the stock price is pulling/bouncing back, don’t be frightened as it is only an example of price patterns.Strategy 2 – Trendline Breakout Forex Trading Strategy
Trendline breakout is another trading strategy that works well if you use it with strategy 1. It is the reciprocal of trendline trading. Consider having a trendline on stock price, and you’ve been hoping to remove continuation trades from it:- With this strategy, you are trading with the ups or downs on the trendline. This implies that the stock price regards the trendline.
- With trendline breakout, the rules and regulations become possibly the most important factors when the trendline is intersected or broken by the stock price.
- This implies that the present pattern has now changed, so you should be hoping to leave the trades that rely on the trendline forex trading strategy. Now, you should open a trade in the opposite manner. And that is the essence of the trendline breakout strategy.
Strategy 3 – Support and Resistance Forex Trading Strategy
If you are looking for the simplest and universal trading strategy, then you must go with support and resistance. This trading strategy is highly applicable not only to Forex but also to any other market in the world. Professional traders are always keeping their eyes on the support and resistance levels to see how the price is going to behave. They monitor if the market will soon bounce off, and the stock price is going to reverse or head up or down to the level of resistance. At that moment, they decide to dive into the market with new orders. “The key element of this forex trading strategy is price action analysis.”Strategy 4 – Support Level Breakout Forex Trading Strategy
Say, you were keeping an eye on the support level but it didn’t hold, so you’re unable to use the support and resistance strategy. Here comes another trading strategy for you, and this method helps you trade the break of the support. One of the best features of this Forex trading strategy is that there will be times you will get the change from the uptrend to the downtrend once the major support level of the stock has broken. By using this type of strategy, you can easily end up making a significant portion of your profit at the end of your financial period.Strategy 5 – Resistance Level Breakout Price Action Forex Trading Strategy
At the point when the resistance level of the stock has broken, the price of the stock tends to move up and could be focusing on new highs. Or if the support level is going to break, then you might observe the downward trending of the market turning over into an upturn. This strategy will show you identical levels of both breaking and holding. Most of the time, however, it will be covered up in the everyday price action forex trading. Therefore, you are left with very little time to monitor these patterns to set your Forex trading up.Strategy 6 – Trading Strategy for All Timeframes
This is one of the best Forex price action strategies that is highly suitable for all timeframes. The key element of this strategy is the support and resistance level. And commonly, it is called Forex Price Action Trading.- Indicators: Price Action Forex Trading;
- Timeframe: Any;
- Pair of Currency: Any.
Rules of Trading Strategy for All Timeframes
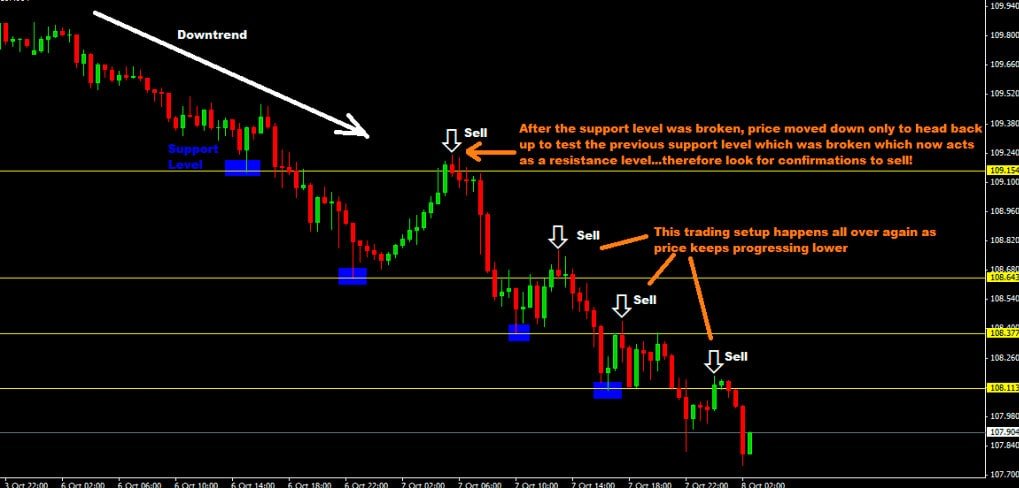
Selling:
For a selling setup, the support level must be broken first, and then you must see the price move down for some time. After that, it will start rising again to test the broken level of support. To enter the trade, you can either set up:- Sell limit order;
- Instant market order;
- Sell stop order.
Buying:
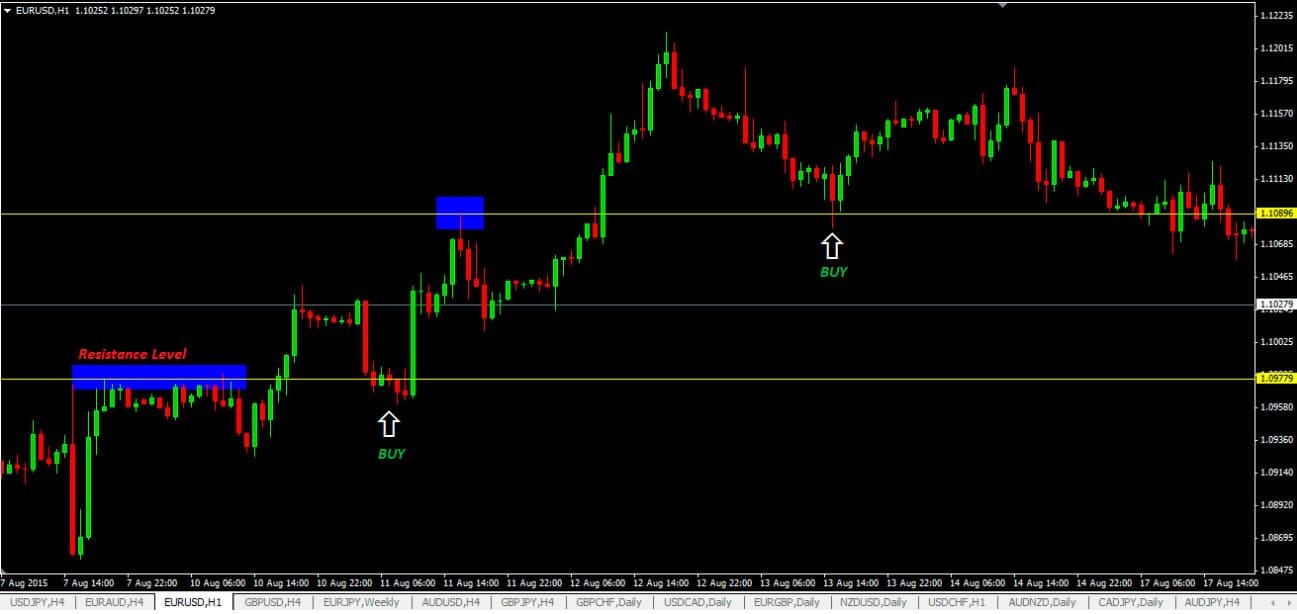
To buy a stock, the resistance level must be broken first. After that, the price will start moving up for some time, and then it will start falling to test the broken resistance level. To enter the trade, you can either set up:- Buy limit order
- Instant market order
- Buy stop order
Strategy 7 – Daily Pin Bar Price Action Forex Trading Strategy
The daily pin bar is one of the most appealing and beneficial trading strategies if you love trading on daily candlesticks and especially the pin bars. Many of us are well familiar with the fact that reversal candlesticks are great powerful pin bars when they form around the resistance and support level area. If the low or high levels of the pin bars break, the market will start moving toward the breakout. This breakout will increase exponentially. With this forex trading strategy, you can make a lot of profitable trades.Strategy 8 – 123 Forex Price Action Trading Strategy
123 Forex Trading Strategy is entirely based on price action and the basic structure of the Forex market. In any market, there are patterns of extreme highs and extreme lows. The following chart depicts the concept behind the 123 strategy.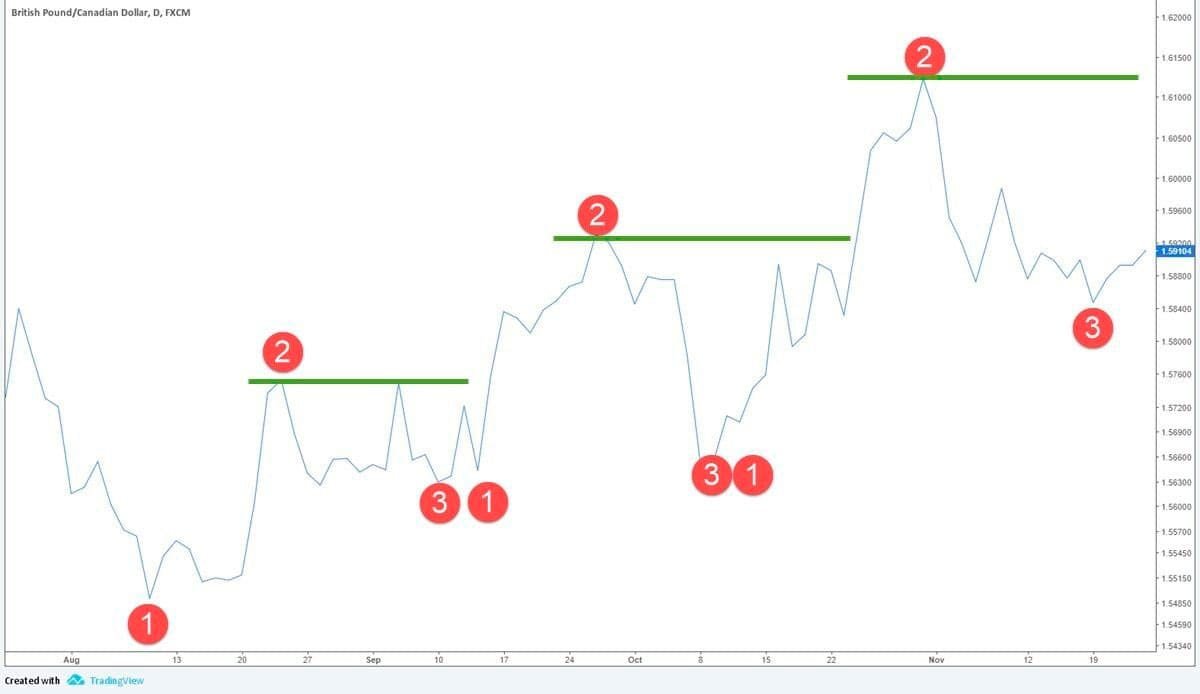
Strategy 9 – Railway Tracks Chart Pattern Price Action Forex Trading Strategy
Here comes another interesting strategy where you will see two candlesticks similar in length but the opposite in terms of intentions. One of them is bullish, and the other is bearish. Whenever you notice railway tracks, the trend of the market is going to change. Moreover, if you see this form of pattern in resistance and support level, get ready to trade.Strategy 10 – Multi-Timeframe & 123 Forex Trading Strategy
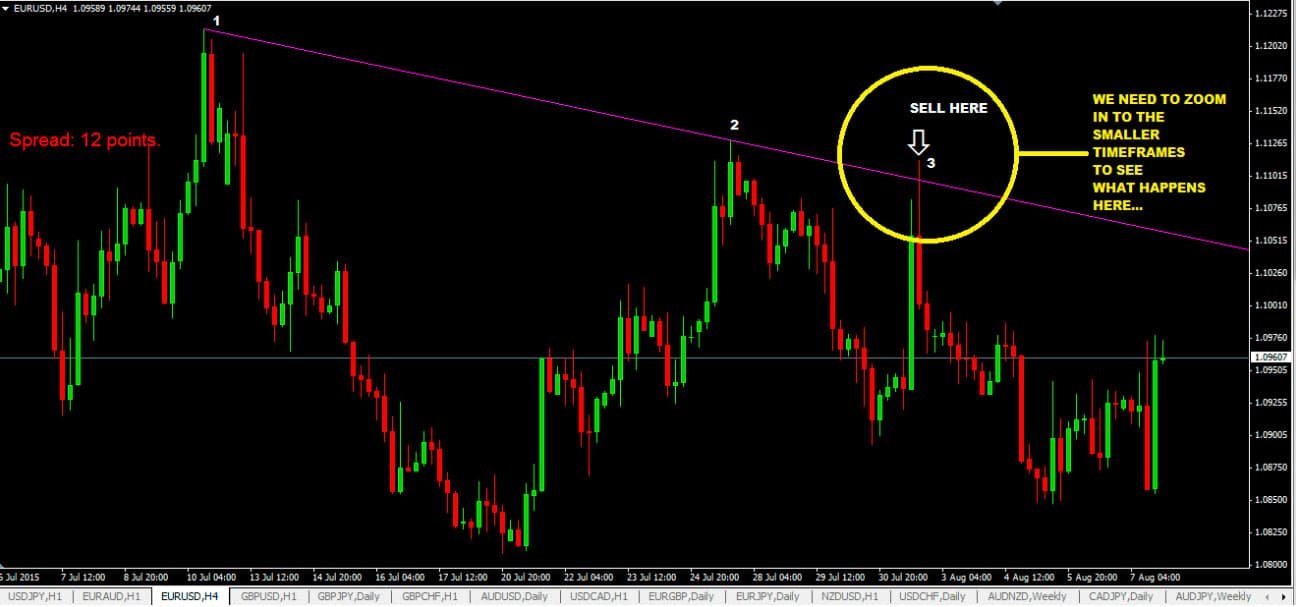
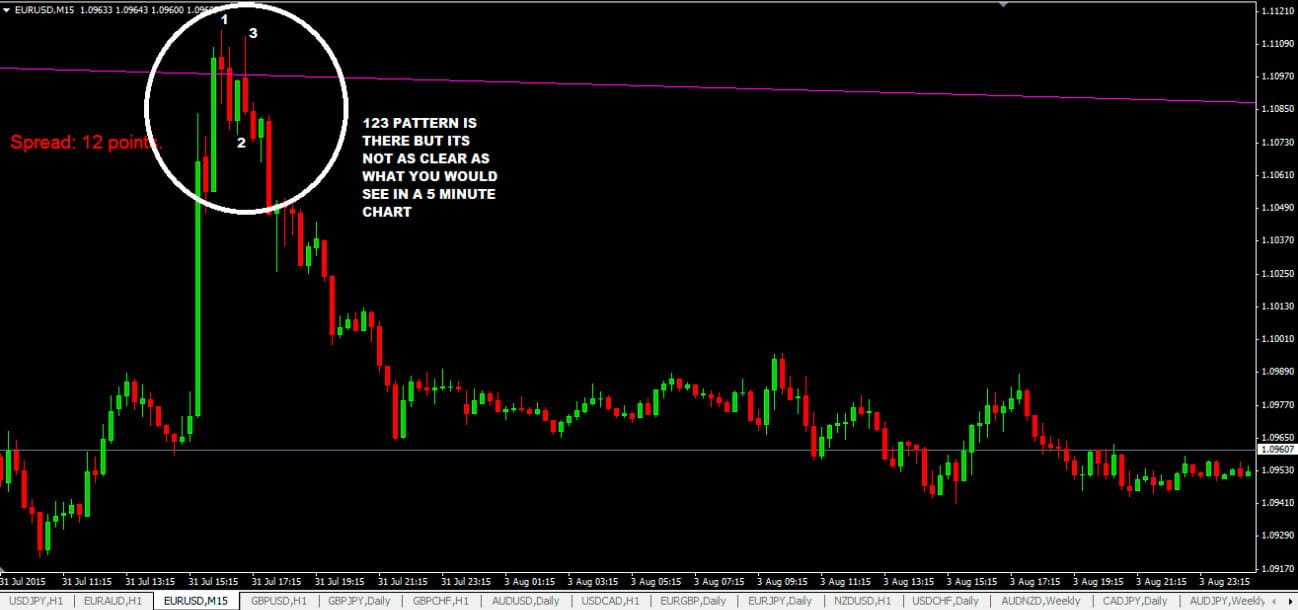
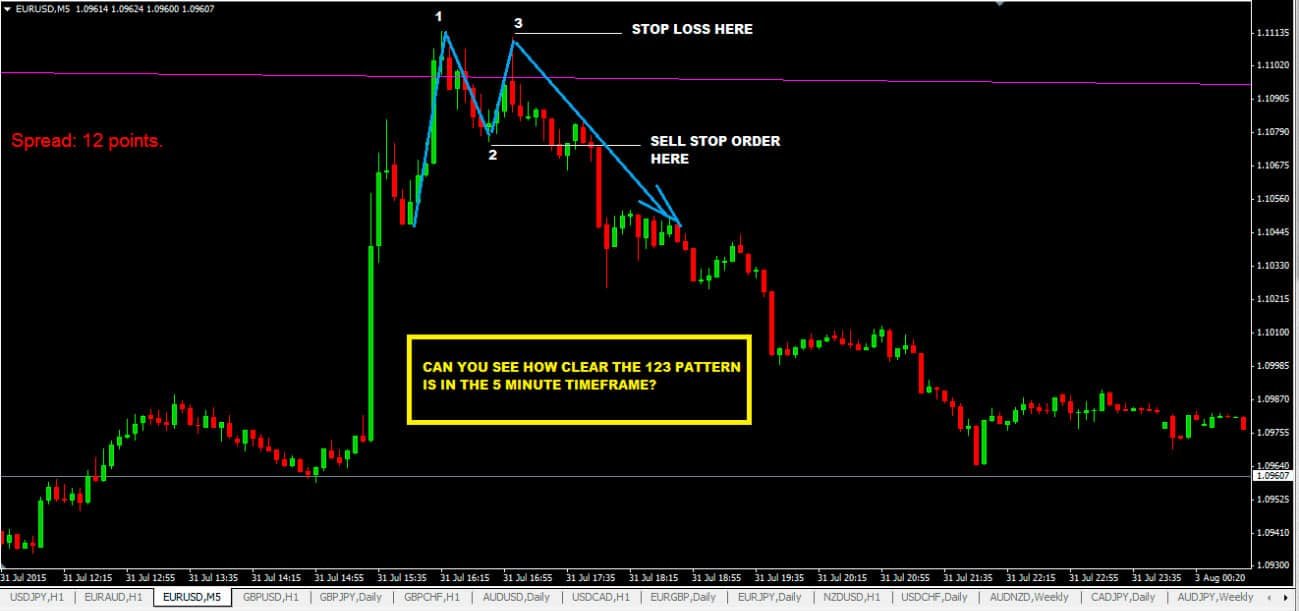
Multi-timeframe means that you are using several combinations of timeframes to watch a setup, and the actual trade is in a much smaller timeframe. We are going to discuss the trendline trading strategy of selling that has fetched up 100’s of profitable pips with extreme ease. But it is a 4-hour timeframe. Let’s have a look:- What happened in the last 15-minute timeframe?
- What happened in the last 5-minute timeframe?
4-HOUR CHART
15-MINUTE CHART
5 MINUTE CHART
Strategy 11 – Inside Bar Price Action Forex Trading Strategy
This strategy doesn’t need any other indicators as it is entirely based on the Price Action Trading Method.- Pair of Currency: Any;
- Timeframes: 4-hour or daily timeframes are preferred;
- Forex Indicators: Price Action.
What is Inside Bar?
- Inside bar is the formation of 2 candlesticks.
- The first candlestick in the formation is called the Mother Candlestick
- The second candle just after the Mother Candlestick is called the Inside Bar and is engulfed entirely within the highs and lows of the Mother’s shadow.
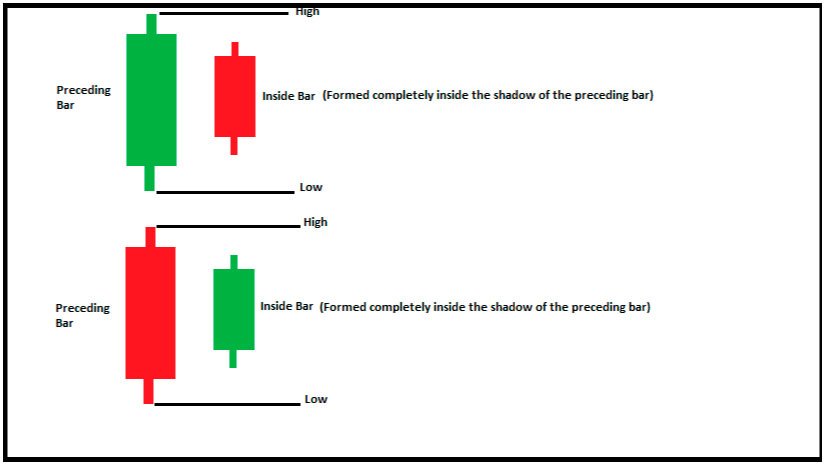
- Bullish
- Bearish
- Bullish
- Bearish
How to Manage Price Action Forex Risks?
You must know how to manage your risks. Keep in mind how to correlate risks with your profits and losses. Let’s have a look at the table shown below.
Conclusion
All in all, price action trading is a general form of trading without any indicators. It helps traders analyze the market with the help of price charts and candlestick patterns. Here are the main pros and cons.Price Action Advantages
- No need for any expert advisors and expensive tools.
- Easy to understand the basics and analyze any currency pair.
- Trade with delayed orders minimizes the risk.
Price Action Disadvantages
- Price action traders skip the understanding of the market.
- You may have precise instructions on when to close or open.
- You don’t try to predict the actions of other participants.


