Prévision hebdomadaire du Forex et Analyse FX Octobre 26-30

EUR/CHF
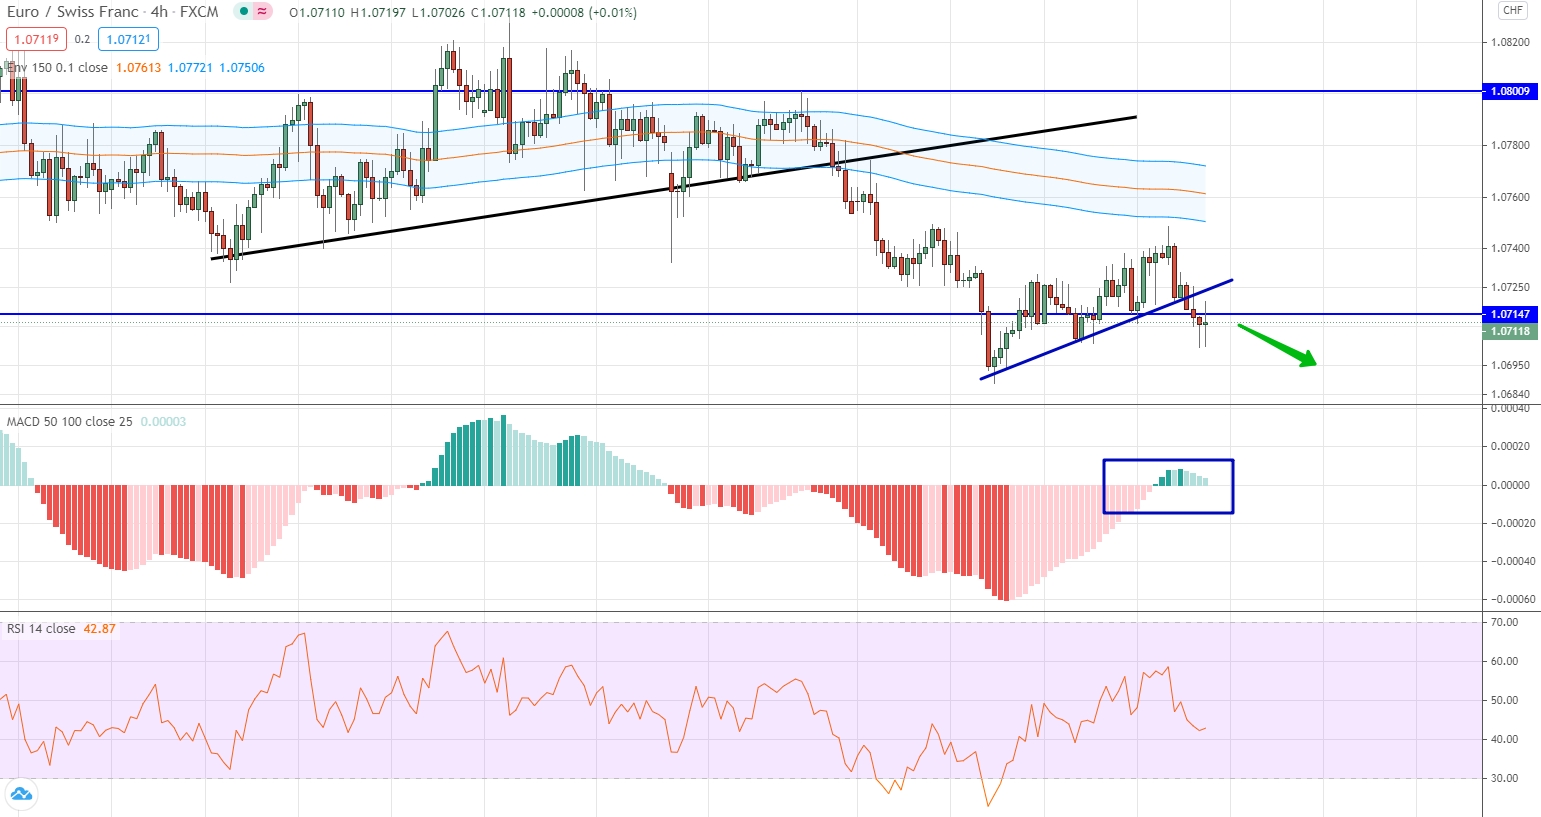
The euro moved upward against the Swiss franc last week, forming a local uptrend line. The movement itself was not very strong, but it reached the level of the moving averages, after which a reversal occurred. you should pay attention to the position of the histogram, which went into the positive area, but literally immediately changed the color and slope of the bars. At the same time, the price dropped below the trend line and makes an attempt to consolidate below the level of 1.0714. Thus, we can talk about attempts to form a downward trend, which means we are considering trading options for a fall.
NZD/USD
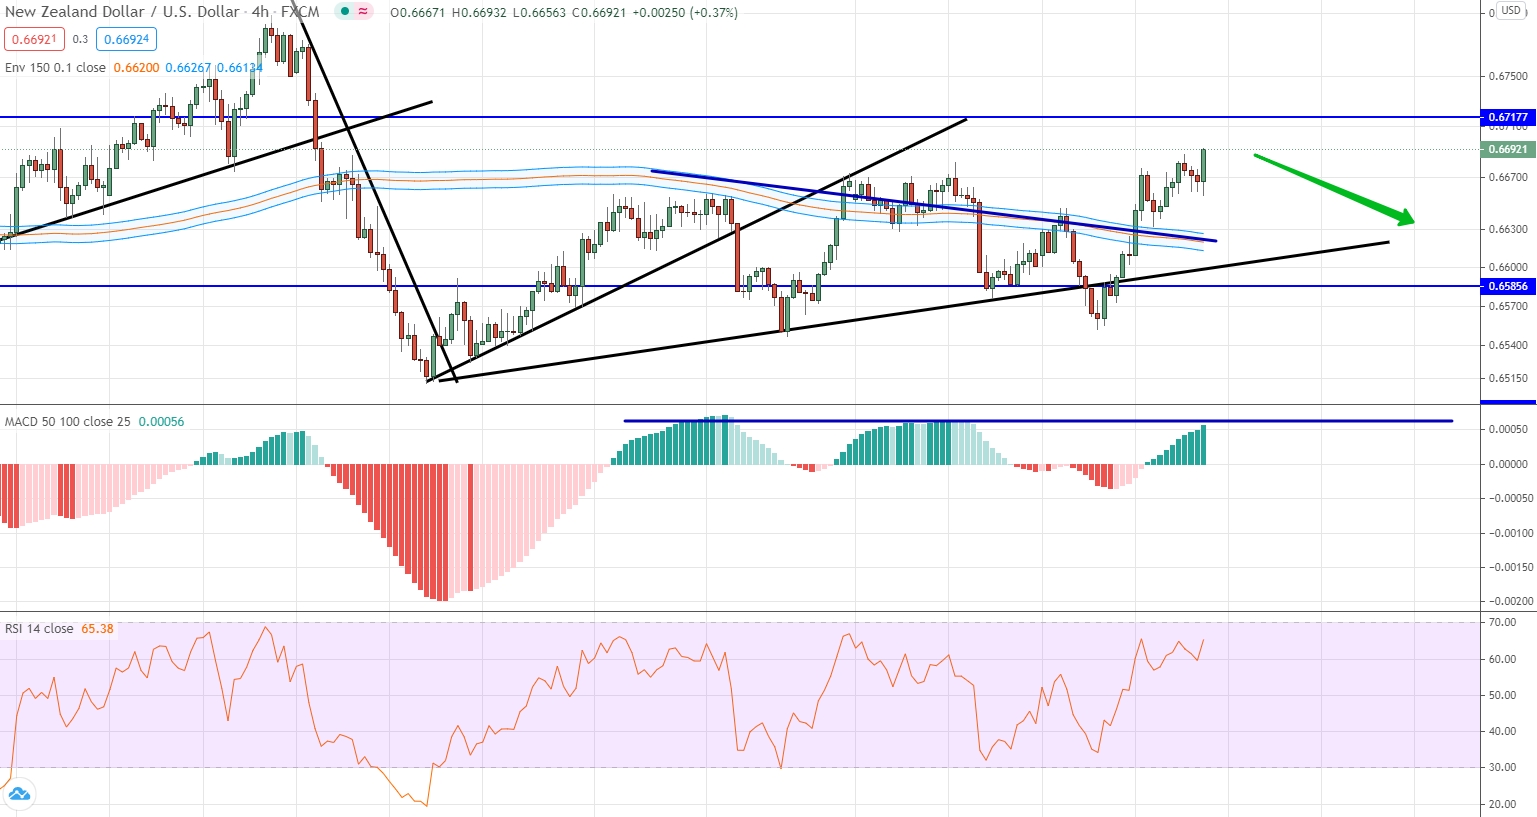
This currency pair led to the formation of the second uptrend correction line. The weakness of this trend can be traced at least according to the indicators of the histogram, which develops strictly horizontally and does not show impulsive movements. At the same time, if you look at the level of moving averages, then it looks down, which reinforces the fact that there is a correction and reinforces the fact that the market has the potential for a downward movement. The price moved very far up both from the trend line and from the level of moving averages. Thus, there are all prerequisites for trading down.
EUR/RUB
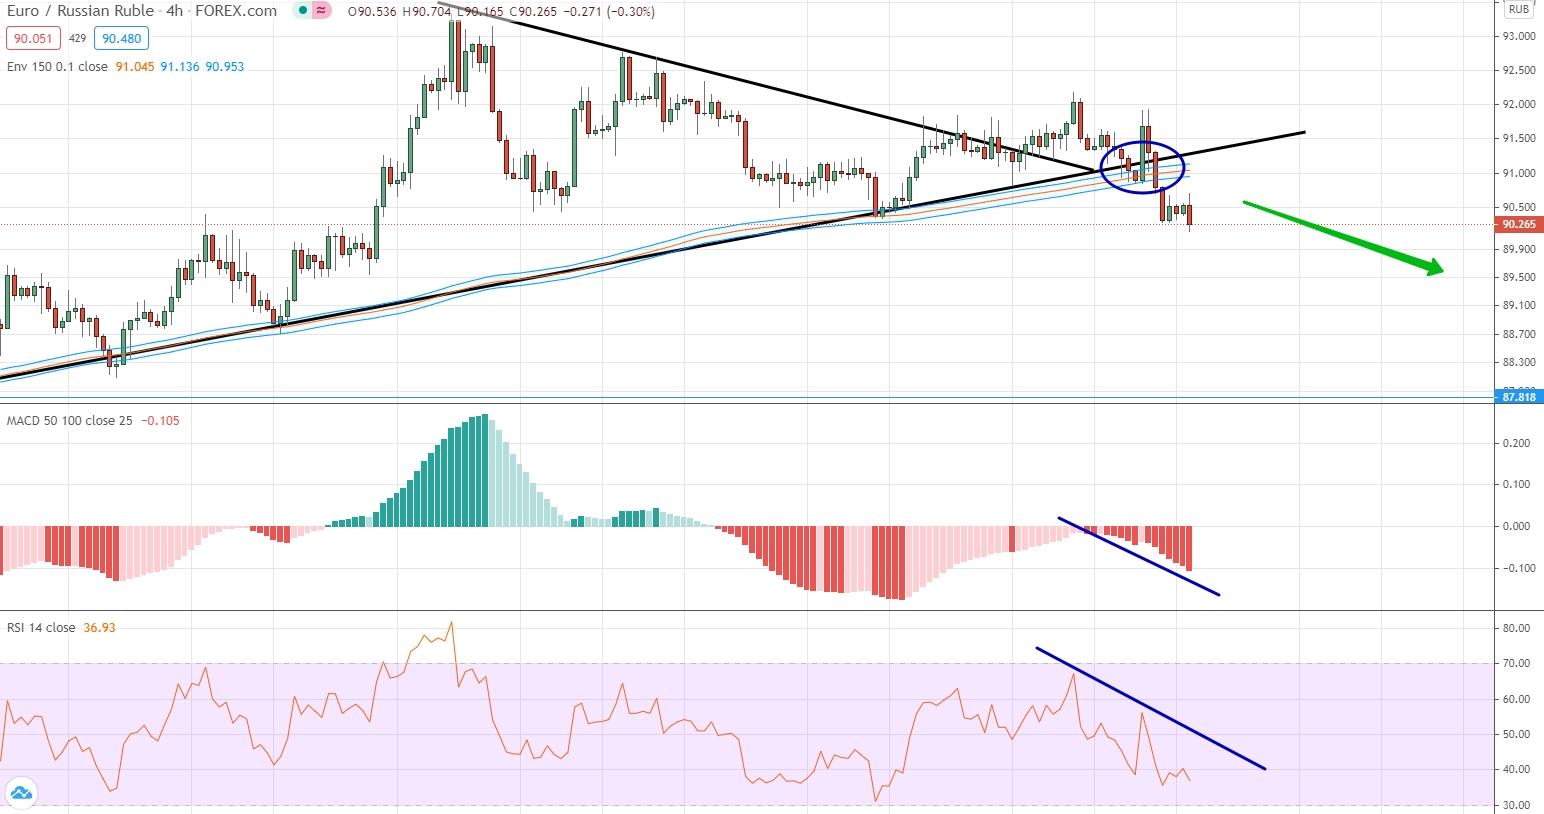
The development of the triangle figure for this currency pair turned out to be false as the macroeconomic news sent the price down. As a result of this movement, the price was below the trend line and below the level of the moving averages. By the way, these two lines are very close to each other. If you look at the indicators, then they all look down and they all have not yet reached their local maximums, which is one of the indicators of their strength and strength of the current movement. Thus, there are all the prerequisites for trading for a fall. However, we keep in mind that the global upward trend is still incomplete.
AUD/CHF
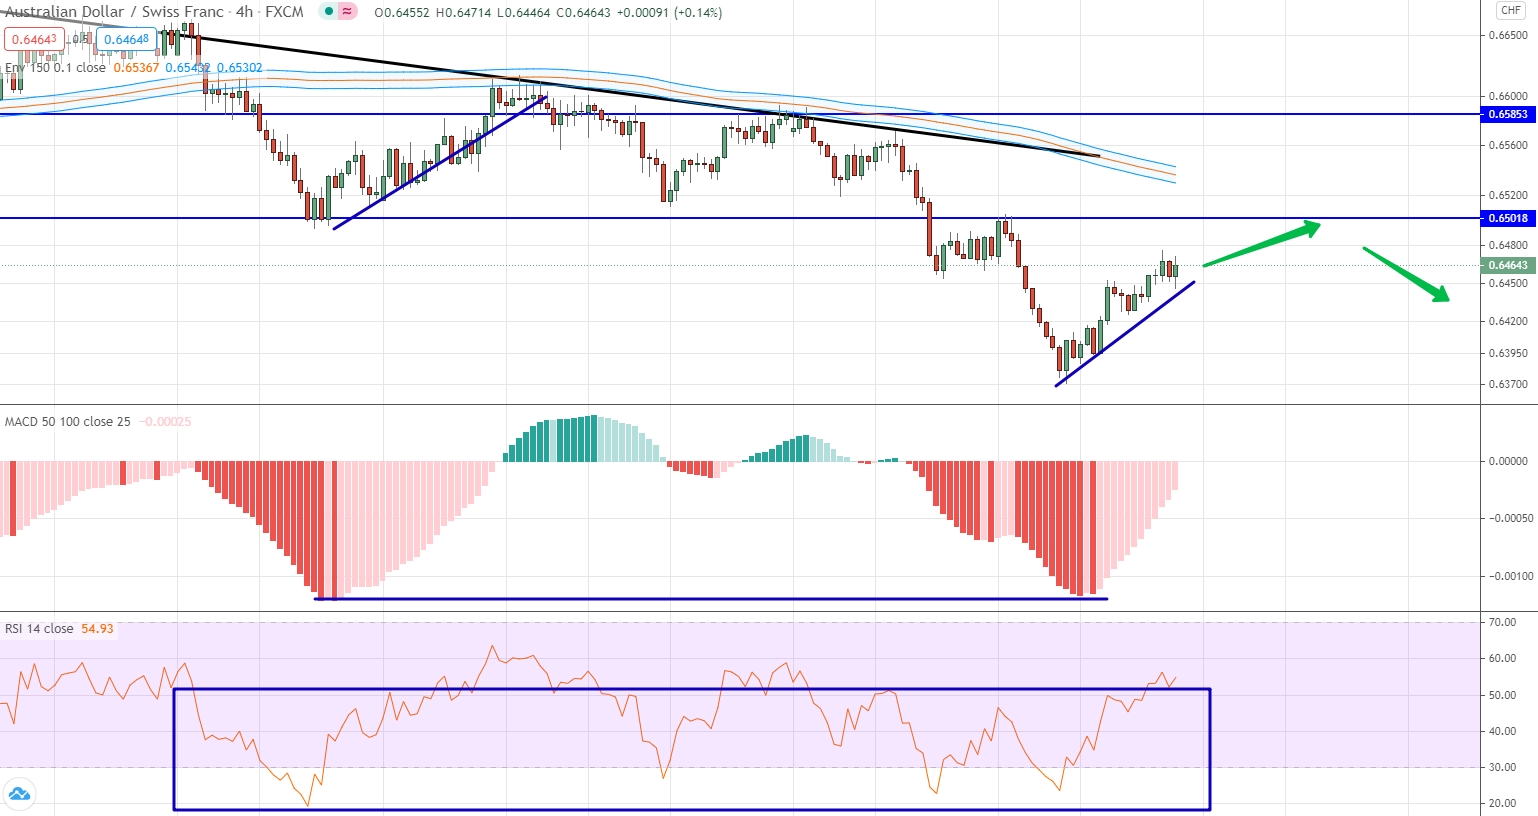
The global upward dynamics at the current stage has been replaced by a downward correction. The downward movement itself turned out to be quite strong, as a result of which all indicators were in the negative area. Oscillators are already close to the oversold area and cannot move far away from this area. An interesting position on the histogram, which repeated its local minimum. The previous time, when similar minimum values were reached by the market, there was an upward movement that ended at the level of the moving averages. now the upward movement is already underway, but it still has the potential to reach the moving averages and the 0.6501 level. We expect the price to reach this level, after which it will return to the main trend and continue the downward correction.
GBP/CAD
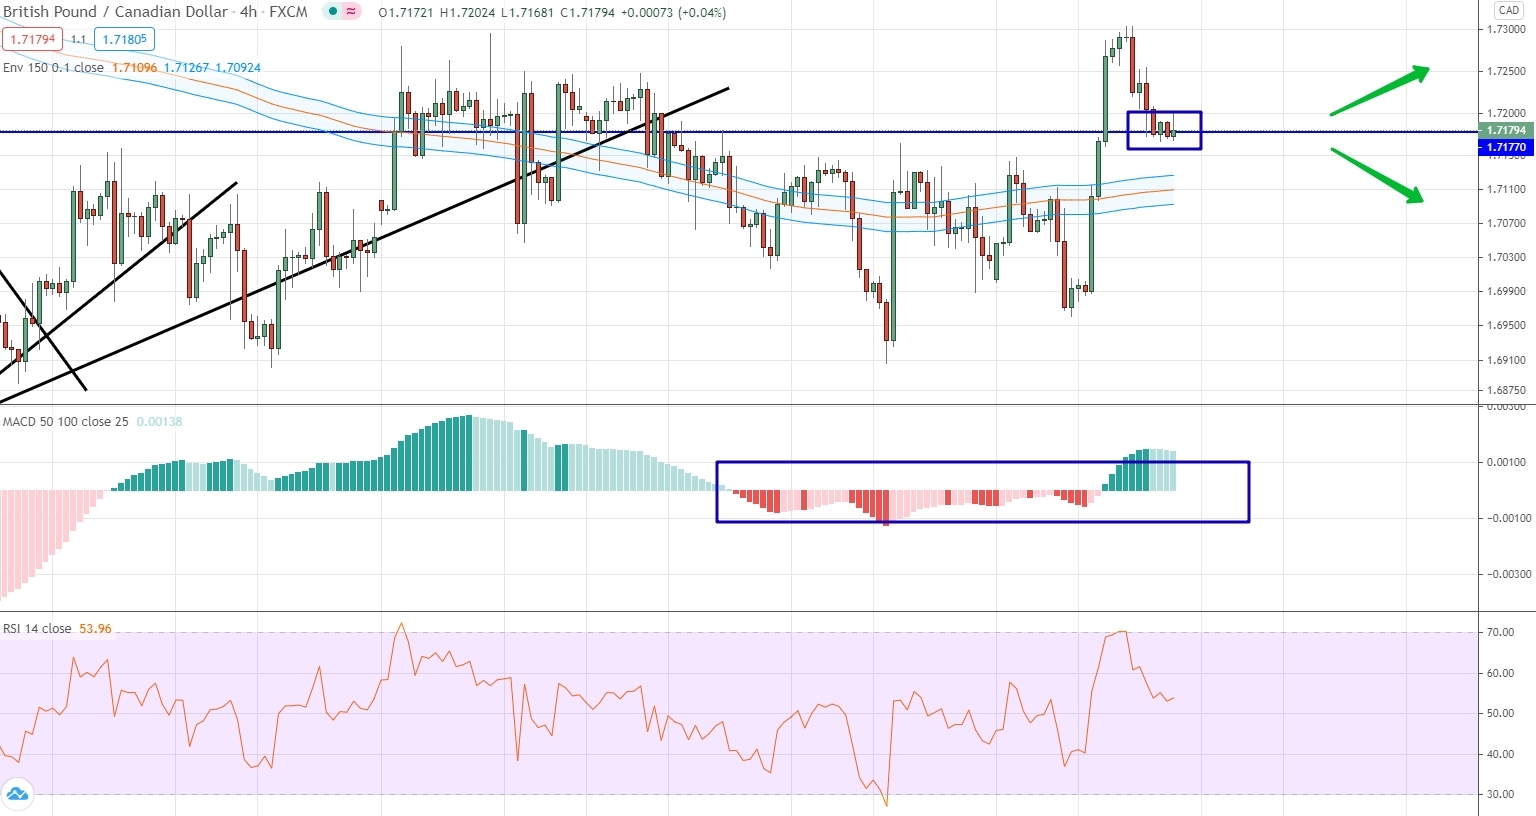
This currency pair is characterized by a stage of market uncertainty. This can be seen very well in the price chart, where various candles are formed, but they are united by the fact that most candles have long shadows, which, moreover, are formed in both directions, which is the most important signal of uncertainty and instability. If you look at the histogram and other indicators, they are close to neutral values and do not give any signals for practical trading. Now we can only talk about the presence of the level 1.7177. The price tests this level and the direction of trade depends on which direction it moves from it. In fact, in which direction the movement starts, in that direction and open the contract.
NZD/CHF
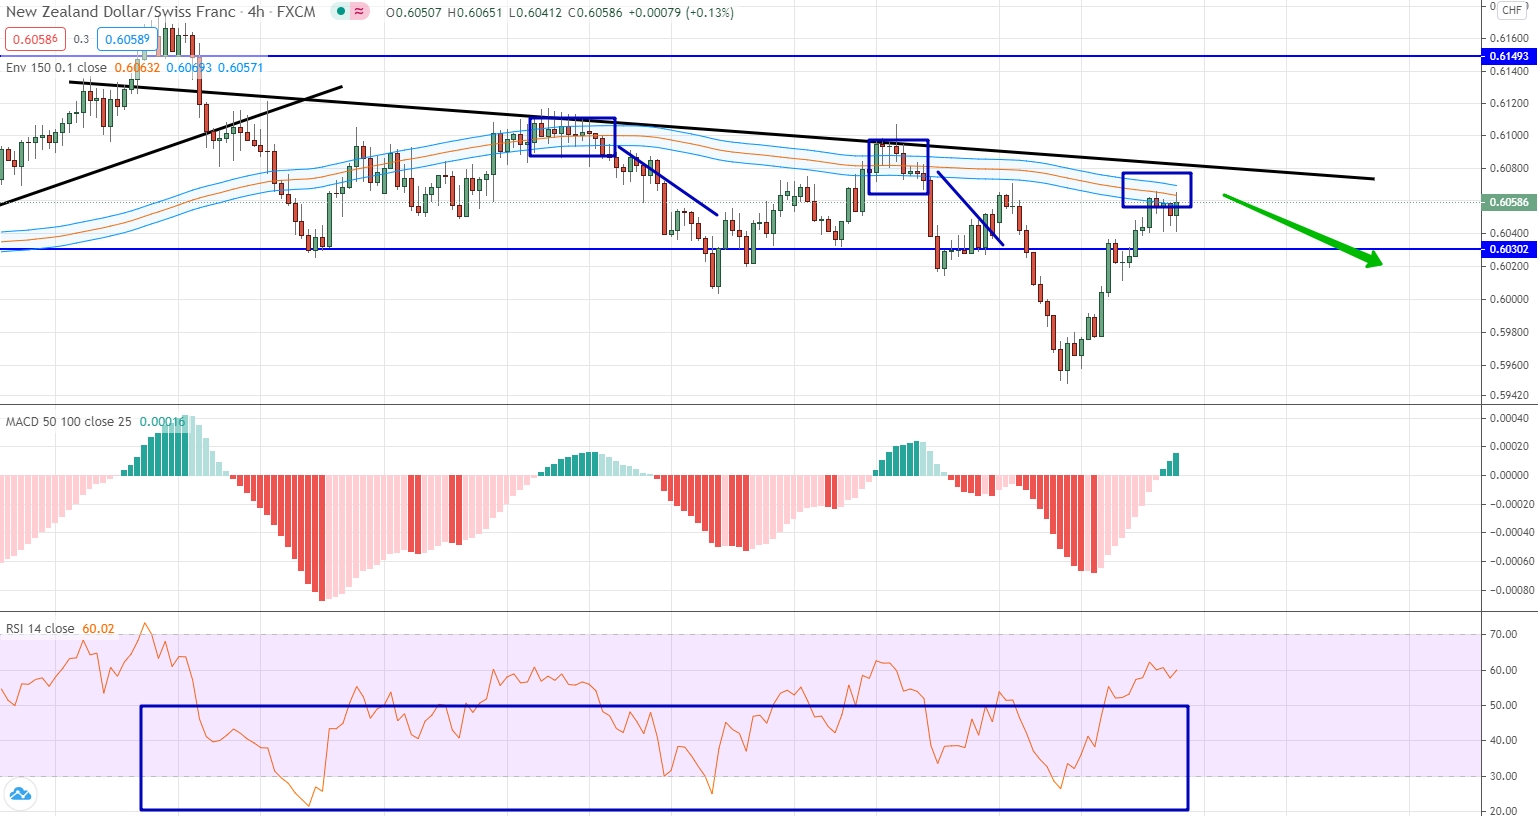
The main dynamics for the New Zealand dollar against the Swiss franc continues to be downward. The downward movement is clearly traced across all indicators, where it can be seen that the downward movement is impulsive, and the upward movement is just rollbacks. In this case, pullbacks will certainly reach the level of moving averages, after which a downward movement occurs again. The current market stage has already reached the moving averages, which means here and now there is every reason to trade for a fall.
USD/CNH
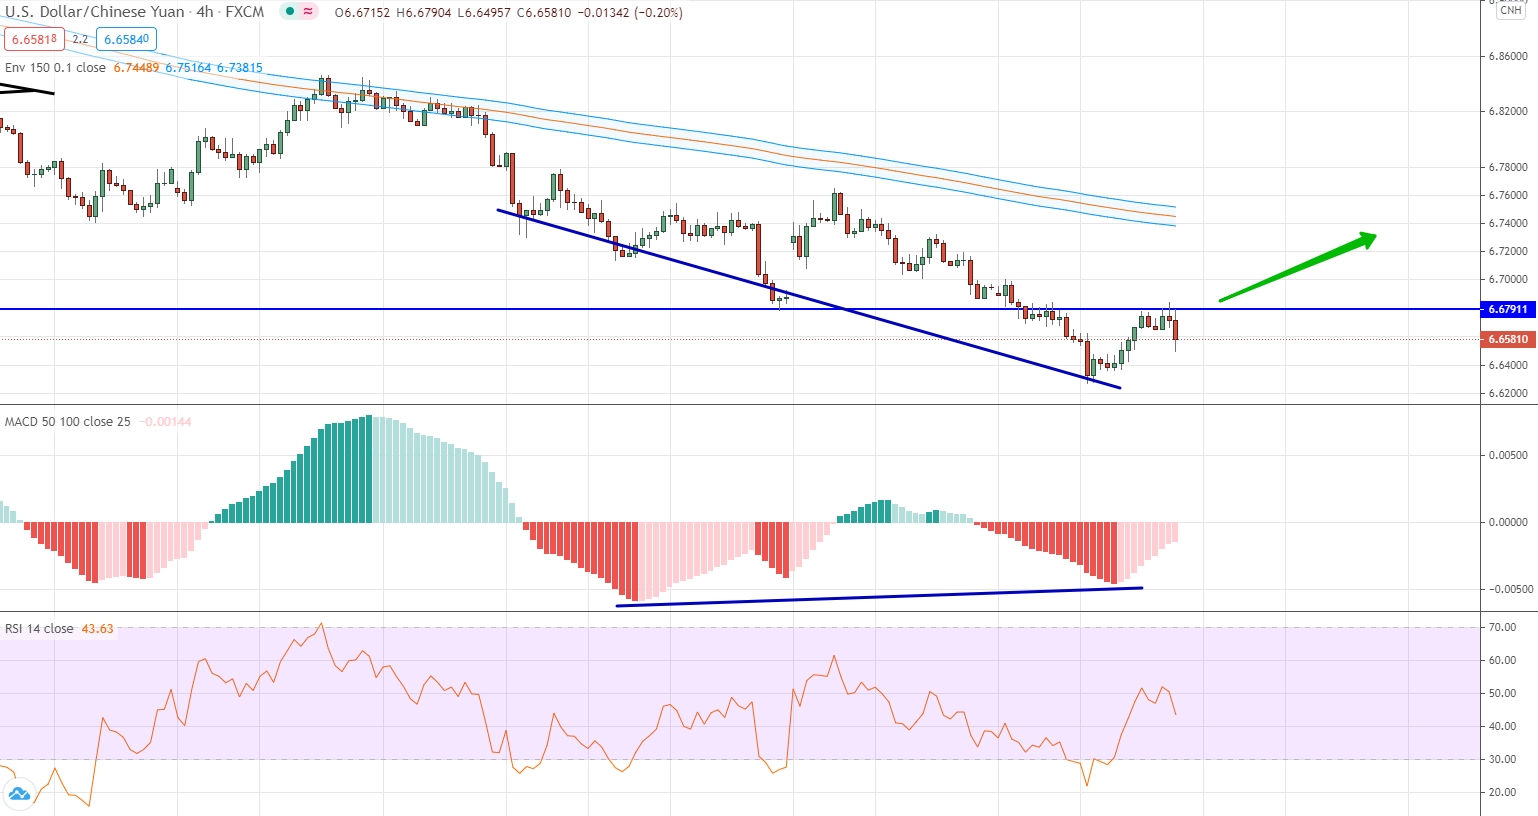
The negative fundamentals for the US dollar led to the fact that this currency pair was below the level of 6.6791. It is interesting that if we consider the price relative to the histogram, then there is a divergence, albeit an implicit one. For the global, we are still talking about the presence of a downtrend, which means that you can trade exclusively for a fall. An upward contract is possible only if the price turns out to be above the designated level. The probability of this event is very significant.
