Guide on using the Butterfly Pattern

Gartley patterns are a whole section of technical analysis that uses Fibonacci ratios. As the name suggests, this approach was named after its creator, Harold Gartley, and gained popularity due to its amazing ability to adapt to any market and decade. The patterns are so accurate that they are likely to be tested on all instruments.
Harold set himself apart from most famous stock traders who had some success in speculation because he began his career in the financial world with a specialized education from the University of New York. Later, he began to learn the fundamentals of working on Wall Street from the bottom up, and it was only after that that he began to develop his own methods and teach others.
Many new traders today categorically refuse to buy courses from recognized authorities, citing the high cost of such products as the reason for their decision, and even accusing teachers of fraud. However, Harold Gartley was able to sell his course for $ 1,500 in 1935 dollars, which is equivalent to $ 26,100 in today's dollars - a significant sum, especially considering the number of students he had. Back to the models, they are all available for free today, thanks to a lyrical digression.
The main Gartley pattern is called "butterfly" because it resembles the flapping wings of the same-named insect. It is known in the literature as "Gartley 222," which was popularized by Larry Pesavento, a follower of harmonic analysis, who justified the use of such "jargon" by pointing out that the butterfly is mentioned on page 222 of Gartley's original book, "Profits in the Stock Market."
Building and analyzing the pattern
First, let's take a look at a basic ABCD pattern. This is the most straightforward fixed ratio model, as it is based on extreme points and provides a signal in the trend's direction after the correction is complete. This is, in fact, the standard "flag," but with ideal parameters. In practice, this model can be divided into two types:

The distinction lies in the different Fibonacci levels used to calculate the corrections. By the way, not only standard Fibo ratios but also their derivatives, are used in the modified Gartley models. Fibonacci retracement is the name for this type of analysis. It is not necessary to deal with such subtleties in practice; it is sufficient to remember the ready-made instructions, especially now that special programs and indicators automatically mark the actual patterns.
As you can see, bearish patterns were used as an example because bullish patterns are diametrically opposed to bearish patterns. Because the author makes no significant reservations about the characteristics of volatility in both falling and rising markets, finding entry points becomes even easier.
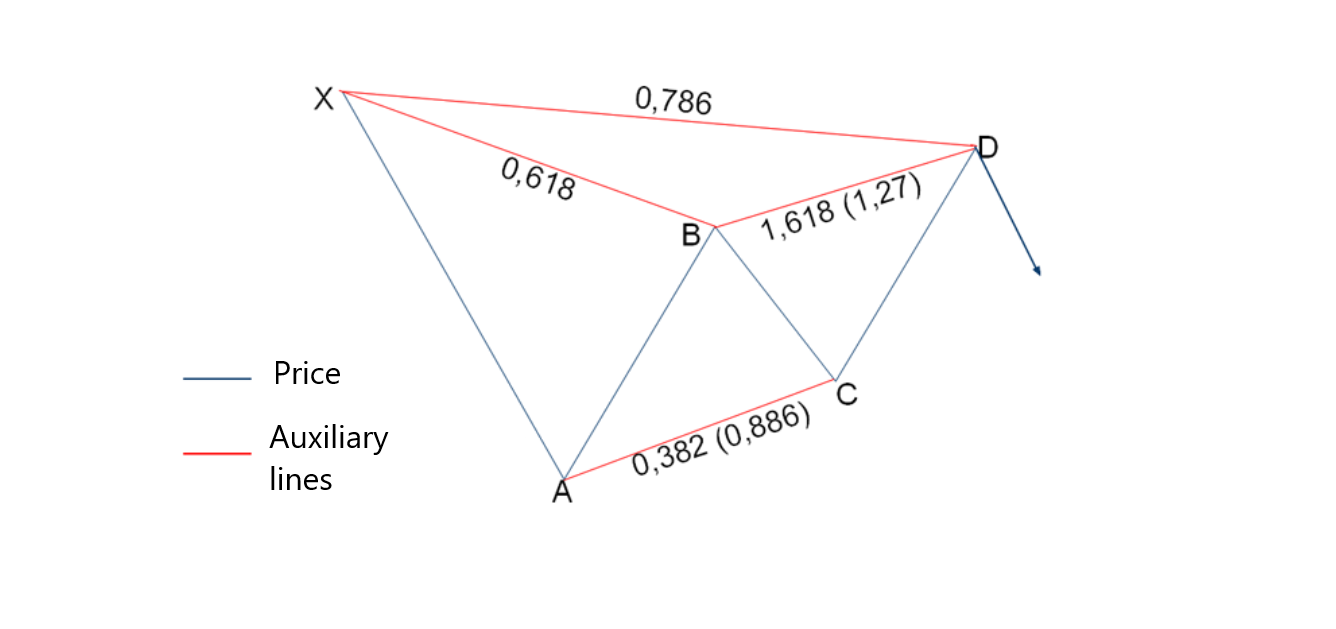
The Gartley Butterfly is almost identical to ABCD, with the exception that point A is preceded by a strong impulse in the trend's direction. As a result, the AB distance is calculated in relation to the duration of the previous impulse using Fibonacci ratios. Furthermore, for the sake of brevity, we will simply indicate an alternative marking option in brackets in the diagram; for example, the following are ideal parameters for a bearish butterfly:

Thus, point B is formed after the price correction to the 61.8 level relative to the distance traveled XA. C - correction to 38.2 (or 88.6) of the AB distance. The last extremum D requires compliance with several rules:
- in relation to BC, the price should reach the projection of 161.8;
- the distance from A to D must correspond to a 78.6 retracement of XA.
In general, the Gartley butterfly formation is similar to the Elliott Wave Correction (ABC). It is built on the same broken lines of the ZigZag indicator, relying on the correction Fibo levels. However, there is still some difference:
- The Gartley butterfly is formed according to the rule of equality of waves AB and CD.
- The Fibonacci tool is stretched along with the entire XA wave in such a way that point B is located at the Fib level of 61.8, and point D is at the level of 78.6.
- So, we get a technical analysis figure that is visually very similar to the wings of a butterfly.
If only one set of ratios is used, the Gartley butterfly will give accurate signals. In other words, if the numbers outside the brackets were previously used, they should be used exclusively until the very last point. If you combine multiple options into a single model, it may fail to converge at point D. Because deviations from Fibonacci levels are acceptable, you should not strive for perfect ratios; otherwise, signals will appear infrequently. Furthermore, the standard Gartley butterflies did not have fixed Fibo-ratios at first; Larry Pesavento and Scott Carney later became aware of this issue.
In the process of Forex trading, searching the price chart and manually building this chart pattern is a rather complicated procedure even for experienced traders. To simplify this process, special technical indicators have been developed, the most popular of which is the ZUP indicator.
Entering the deal
How to enter a trade when the "Gartley butterfly" reversal pattern is formed on the chart? First, you need to determine which indicator is bullish or bearish and enter the market in the direction of the reversal.

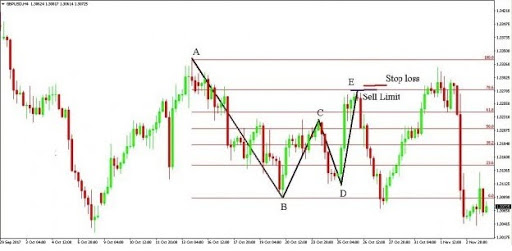
Let's consider an example of a sell entry. We see that a bearish pattern has formed on the chart. Having designated the location of point E, it is necessary to set at its level Sell Limit, and with the aim to the south, select the level of point B. Stop-loss in this case should be set based on the Fibonacci grid. It should be above the 78.6% level. For reassurance, a stop-loss order can also be placed at the level of point A in order to avoid hitting it by a shadow or currency spread. However, in this case, the stop loss to take profit ratio of 1: 3 and higher must be observed.

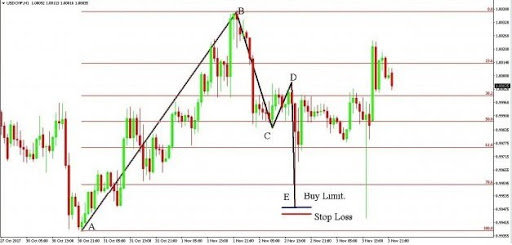
To enter a buy, we need a bullish Gartley butterfly pattern. In this case, the entry is similar to the sell entry, only in the opposite direction. We place a Buy Limit in the area of point E and wait for the profit to be taken from a purchase above point D. The stop order is placed below the Fib level of 78.6.
Final words
As you can see, plotting this reversal pattern on the chart is a troublesome process that requires time and clear mathematical calculations. However, it has already been automated - there is an indicator that allows you to apply a pattern to a chart without any extra effort. It can be installed in the MetaTrader trading terminal, then found in the ""Indicators"" folder, and transferred to the chart. As a result, when such a reversal pattern appears, the figure will be drawn automatically, and the trader's task will be to enter the market.
It is worth recalling: the older the time frame on which this pattern was formed, the stronger its signal is. In this regard, the ZUP is good for finding medium-term reversals on periods of four hours or more. In this case, the profit from the transaction will be greater than with intraday trading, and the probability of exiting at the stop loss, if it is set correctly, is not so high.
"The appearance of the "Gartley butterfly" on the charts does not occur often, however, knowledge of this pattern expands the trader's trading arsenal, which makes it possible to see more reliable signals for entering the market and making a profit. bAmong the varieties of this figure, there are also such models as "crab", "shark", "bat" and "Pesavento butterfly".


