EUR/USD Eyes 50-Day SMA as ECB Slows Pace of PEPP for Second Week

EUR/USD Rate Talking Points
EUR/USD climbs back above the 200-Day SMA (1.1883) as the European Central Bank (ECB) scales back the pace of the pandemic emergency purchase programme (PEPP) for the second consecutive week, with recent developments in the Relative Strength Index (RSI) indicating a further appreciation in the exchange rate as the oscillator breaks out of the downward trend from earlier this year.
EUR/USD Eyes 50-Day SMA as ECB Slows Pace of PEPP for Second Week
EUR/USD trades back within the descending channel from earlier this year following the failed attempt to test the November low (1.1603), and the exchange rate appears to be on track to test the 50-Day SMA (1.1973) as the ECB’s consolidated financial statement shows the pace of the PEPP narrowing to EUR 15.6 billion in the week ending April 2 from EUR 20.4 billion the week prior.

Source: ECB
It remains to be seen if the ECB will continue to scale back its asset purchases under the PEPP as the account of the March meeting insists that ‘the risks surrounding the euro area growth outlook over the medium term had become more balanced,” and it seems as though the central bank retain the current course for monetary policy as the Governing Council pledges to “review the purchase pace on a quarterly basis at its monetary policy meetings, based on joint assessments of financing conditions and the inflation outlook.”
The comments suggest the ECB will rely on its current tools to achieve its policy target as the central bank warns that “the optimism prevailing on financial markets, reflected in “reflation trades”, seemed not to be shared by businesses and households, which had generally maintained a cautious stance,” with the Governing Council going onto say that “a rise in risk-free interest rates and GDP-weighted sovereign yields needed to be pronounced and persistent in order to exert a material impact on broader financing conditions.”
In turn, the ECB emphasizes that “a possible misperception that the Governing Council was engaging in a form of implicit yield curve control had to be avoided,” and President Christine Lagarde and Co. may continue to endorse a wait-and-see approach at the next interest rate decision on April 22 as the central bank remains “ready to adjust all of its instruments, as appropriate, to ensure that inflation moved towards its aim in a sustained manner.”
Until then, EUR/USD may continue to trade within the descending channel from earlier this year as the ECB insists that “a significant increase in the pace of PEPP purchases for the next three months was widely seen as warranted,” but the decline from the January high (1.2350) may turn out to be a correction rather than a shift in the broader trend as the crowding behavior from 2020 resurfaces.

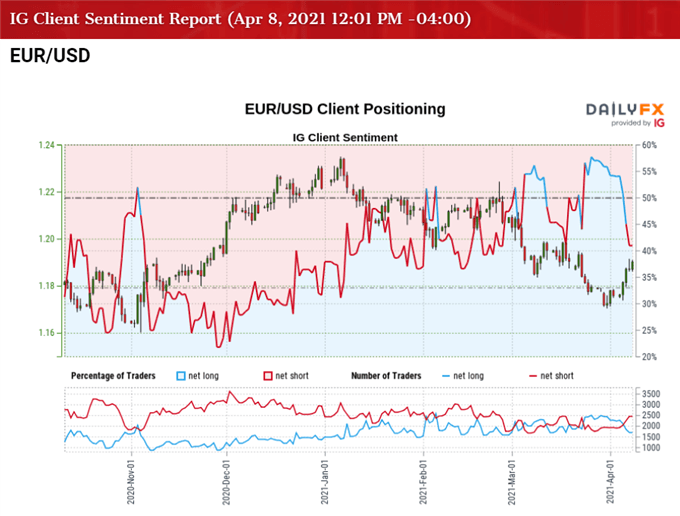
The IG Client Sentiment report shows 41.28% of traders are current net-long EUR/USD, with the ratio of traders short to long standing at 1.42 to 1.
The number of traders net-long is 7.26% lower than yesterday and 27.62% lower from last week, while the number of traders net-short is 3.43% higher than yesterday and 28.06% higher from last week. The decline in net-long position could be a function of profit-taking behavior as EUR/USD climbs back above the 200-Day SMA (1.1882), with the surge in net-short interest has spurring a shift in retail sentiment as 50.53% of traders were net-long the pair earlier this week.
With that said, EUR/USD may challenge the descending channel from earlier this year amid the shift in retail sentiment, and the exchange rate appears to be on track to test the 50-Day SMA (1.1973) as the Relative Strength Index (RSI) breaks out of the downward trend from earlier this year.
EUR/USD Rate Daily Chart

Source: Trading View
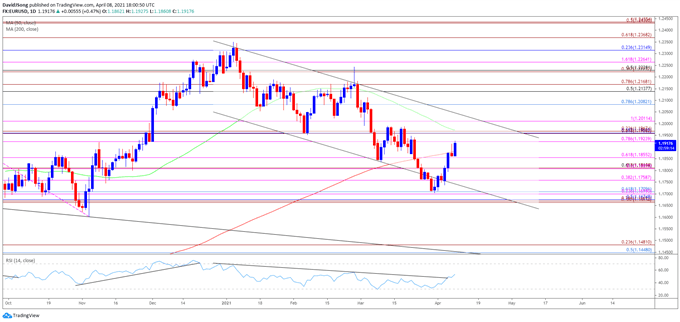
- EUR/USD established a descending channel following the failed attempt to test the April 2018 high (1.2414), and the decline from the January high (1.2350) may turn out to be change in trend as the 50-Day SMA (1.1973) reflects a negative slope.
- In turn, EUR/USD may trade within the March range as the exchange rate approaches channel resistance, but recent developments in the Relative Strength Index (RSI) indicate a further appreciation in the exchange rate as the oscillator breaks out of the downward trend from earlier this year.
- The move back above the 200-Day SMA (1.1883) has pushed EUR/USD towards the 1.1920 (78.6% expansion) region, with the next area of interest coming in around 1.1960 (61.8% expansion) to 1.1970 (23.6% expansion), which largely lines up with the 50-Day SMA (1.1973).
- Need a break/close above the Fibonacci overlap around 1.1960 (61.8% expansion) to 1.1970 (23.6% expansion) to negate the descending channel, which could open up the 1.2010 (100% expansion) region.
Information source - DailyFX.com


