How To Use The Accumulation Distribution Indicator

The renowned trader Marc Chaikin created the accumulation distribution indicator(A/D) in the 1980s as a member of the oscillator family. It is a volume-based indicator that tells if a stock is being accumulated or distributed by traders. In this article, we'll walk you through the function of the ADI, accumulation distribution chart, ADI, and Bill Williams accumulation distribution indicator (WAD), which is different from the ADI.
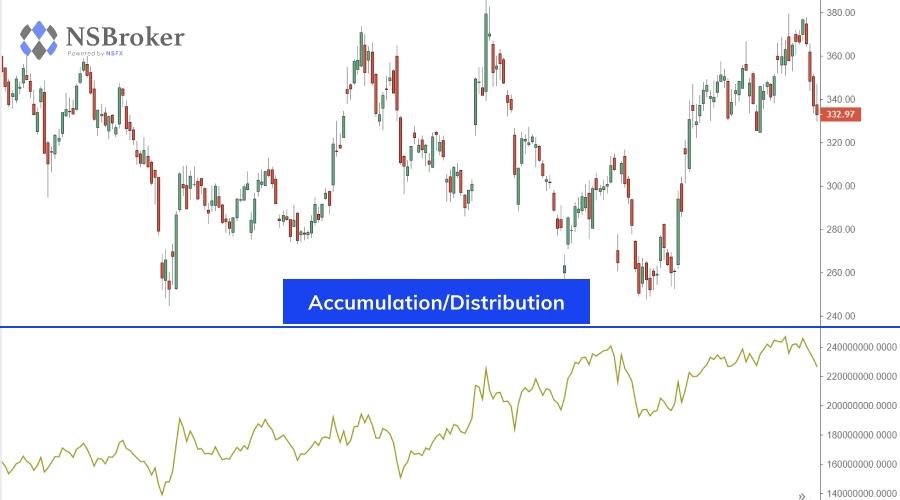
The ADI is originally a stock selection tool that has become a vital indicator in the Forex and other financial markets. By identifying the divergence between the price and the ADI, traders can tell the dominant players in the market- If they are bulls (accumulating) or bears (distributing). In essence, the ADI reveals the connection linking the price of an asset to the number of traders in that particular market.
Accumulation Distribution Line ADL
The accumulation distribution line or index comes in handy when traders want to predict price movement in the market, and more importantly, it indicates the buyers/sellers' pressure at a particular period. It is a vital tool that capitalizes on the connection between the asset's volume and price to predict its future price changes.
Accumulation/ Distribution
To get a picture of how the ADI performs its function, let's take a good look at the definition of its constituent terms in financial markets.
To a trader, accumulation means to increase a position size over reoccurring transactions. An investor is said to be accumulating investments when s/he adds positions to their portfolio. When stocks or other assets are under accumulation, it implies traders and investors are on a buying spree. A decline in the value of assets takes us to the second term of ADI, which is distribution.

In stock, distribution is large chunks of assets that traders and investors sell into the market continuously in smaller units to flood the market with sell orders for the asset, hence, plummeting its price. The accumulation distribution indicator evaluates the movement of money into and out of a financial instrument. It does this by taking into account the trading and volume range over a particular period.
In simpler terms, accumulation in the Forex market refers to buying, while distribution refers to the selling of assets. Therefore, the ADI is a tool that tells the trader which of these activities is having an upper-hand.
The Accumulation/Distribution Formula
A/D=Previous A/D+CMFV where:- CMFV=Current money flow volume
- (PH −PL (PC −PL )−(PH −PC ) /(PH-PL)) ×V
- PC = Closing price
- PL = Low price for the period
- PH = High price for the period
- V = Volume for the period
Accumulation Distribution Strategy
The seasoned traders out there understand there is no ultimate strategy, and no indicator is accurate at all times, notably when used in isolation. The primary function of the ADI is to aid a clear representation of the supply and demand in the market at a given time. With this data, traders can make better trading decisions as they can tell the prevalent activity in the market.
When the accumulation and distribution line falls, it tells the trader that selling (distribution) pressure is dominating the market. Conversely, when the line rises, the traders in the market are said to be accumulating their position sizes.
If the price drops and the ADI rises, traders can brace up for an upward spike in prices, which translates to a bullish reversal. Conversely, if the price spikes up while the ADI is falling, it implies a dip in prices, which also indicates a bearish reversal is about to take place. However, if there is a balance between the ADI and price, it signifies that the current trend is dependable.
In the financial market, horning your skills is as good as the most profitable investments you can ever make. This theory is valid in the case of identifying an actual divergence between price and the AD line. It takes a lot of practice to achieve this feat, lending more weight to the value of a demo account. Many tools in the financial markets do more when deployed with others, and the ADI is a typical example. The use of extra tools and techniques alongside the accumulation distribution indicator can improve its efficacy, and with this knowledge, you can consistently increase your profitability while trading.
Accumulation Distribution Oscillator
Marc Chaikin didn't just stop at developing the ADI in the 1980s. He also went on to create another staple we know as accumulation distribution oscillator ADO. It is a third-derivative technical analysis indicator that reconciles rising or a dip volume with price fluctuations. You can calculate the Chaikin oscillator by deducting a 10-day exponential moving average (EMA) of the accumulation distribution line from a 3-day EMA of the ADL.
In technical analysis, the balance between the buying and selling pressure is what pushes the financial markets. Hence, traders can only predict this balance with the use of various indicators of which the Chaikin oscillator is one of the most desired.
The Chaikin Oscillator goes thus:- N= (Close−Low)−(High−Close)/ High−Low
- M= N * Volume(Period)
- ADL= M(Period−1)+M(Period)
- CO = (3-day EMA of ADL)−(10-day EMA of ADL) where:
- N = Money flow multiplier
- M = Money flow volume
- ADL = Accumulation distribution line
- CO = Chaikin oscillator
Williams Accumulation Distribution Indicator
The Williams accumulation distribution indicator (WAD) should not be confused with the accumulation distribution indicator by Marc Chaikin. The WAD, is in fact, one of the creations of the distinguished trader Larry Williams. The WAD is an indicator deployed in technical analysis to measure bullish and bearish price pressure. It does this by stacking up the negative (distribution) against positive (accumulation) price changes. While the Chaikin accumulation/ distribution capitalizes on volume and price data to measure buyer/seller actions, the WAD indicator depends solely on price data to represent the sum of negative (distribution) and positive (accumulation) price movements. Conclusion Honing your skills is key to successful trading, and so is practice. The accumulation/distribution indicator calls for both constant application and discipline for proper and rewarding usage. The highlight of using this tool is that traders should look out for those rare moments of divergence between the price and the A/D line, as it may indicate a shift in the price trend. Once again, there is no perfect trading tool out there. The best tool, however, is one that fits your trading style.


