Ascending Triangle Сhart Pattern Definition

An ascending triangle is a graphical representation pattern used in trade analysis and commonly considered a persistence pattern. In essence, the pattern becomes significant if it occurs within an uptrend or downtrend.
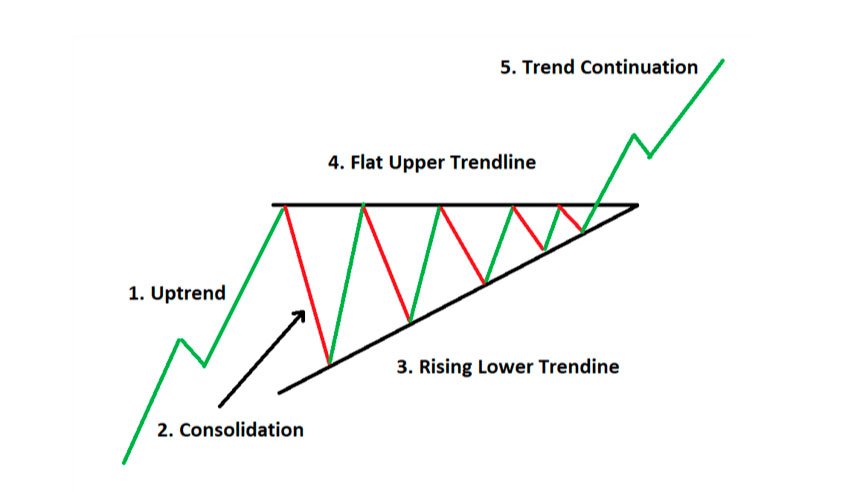
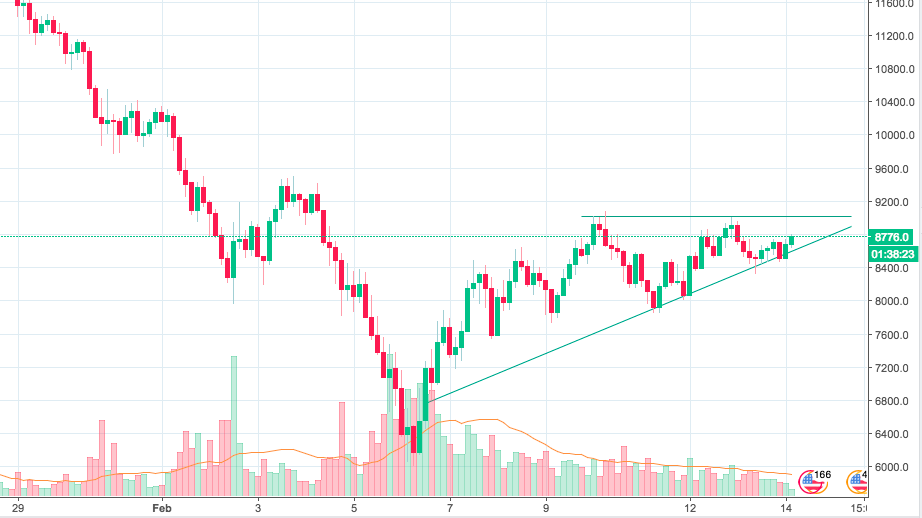
The ascending triangle equally indicates accumulation, which regards it as having a bullish nature. As a result of its triangular shape, the pattern is usually referred to as a right-angle triangle. Two or more equal highs form a horizontal line at the top, and two or more rising troughs equally from an ascending trend line that congregates on the horizontal line. When both lines extend to the right, the ascending trend line might operate as the hypotenuse of a right triangle. Accordingly, when the perpendicular line is drawn starting from the left end of the horizontal line, then a right triangle would appear.
Traders/investors repeatedly watch out for breakouts from triangle patterns. A breakout can happen to either the upside or downside. When a breakout occurs from the triangle, traders aggressively buy or sell assets depending on the trend the price broke out. An ascending triangle becomes tradable because it provides a clear point of entry, identify targeted profit, and bring to an end loss level.
Trading ascending triangle
An ascending triangle is at large believed to be a dynamic pattern, which means that the pattern becomes crucial if it occurs within an uptrend or downtrend. Once the breakout occurs, traders/investors become more aggressive in buying and selling of assets depending on what direction the price broke out.

For the sake of trading, an entry is taken at the price breakpoint. Traders tend to buy when the breakout occurs upside, or sell if a breakout occurs to the downside. Usually, you can place a stop loss outside the opposite side of the pattern. It is worthy to note that a long trade is usually undertaken when the price breaks above the top of the pattern. In contrast, a short trade is taken when the price drop below the lower trend line. In the same vein, a stop loss is positioned just outside the pattern opposite the breakout. You can calculate the targeted profit by recording the height of the triangle at its thickest point and adding or subtracting the same to or from the breakout point. Broad patterns usually present a higher risk or reward than patterns that get considerably narrower as time goes on. As the pattern gets thinner, the stop loss also becomes smaller since the distance to the breakout point is thin. However, the targeted profit still relies on the largest part of the pattern.
Trading the ascending triangle doesn't come without its flaws. One of the main problems with trading ascending triangles is the possibility of false breakouts. The price may shift out of the pattern and fall back in line at a given point, or the price may break out at the other side of the pattern. Ascending triangles provide estimated profit target and the price may surpass that target, or fail to reach the set target.
Ascending triangle forex
A forex ascending triangle is a consolidation pattern that takes place in mid-trend, which typically signals a continuation of the existing trend. The ascending triangle chart is formed by sketching two converging trend lines, as the price momentarily moves in a sideways direction. Traders/investors often lookout for ensuing breakout in the direction of the previous trend, which acts as a pointer to enter a trade.
In the forex market, ascending triangle patterns have some variations that frequently appear in the market. These variations provide traders with better insight into potential price movement and the possible recommencement of the present trend. Traders/investors need to understand that ascending triangle analysis is more about understanding what the market forecast is saying through price action and less of finding the ideal pattern.
Ascending triangle breakout
Breakout is one of the classic methods for assessing the pattern. Those who watch the chart usually wait until the market comes up with an actual breakout because there are no guarantees in the pattern forms. Traders often want to see breakout volume accelerating on the move higher space. Unfortunately, the volume on the breakout does not usually have to be the highest over the last 20 hours, as long as there is some acceleration to the upside. For each bullish breakout that strikes the upward target flawlessly, there is always another batch of trades that outrightly fail or move higher in the breakout.
The targeted profit is usually seen as the distance of the triangle added to the top.
Bullish ascending triangle
The ascending triangle is said to be bullish; this means that the ascending triangle indicates that a security price is prone to climb up as the pattern completes itself. The ascending triangle structure is a persistence pattern that is also known as the bullish triangle because it leads to a bullish breakout. The first element of the ascending triangle is this price pattern. The upward slope followed by a flat top which shows that the market has tried several times to break the resistance top but could not, hence, developed a resistance line. The other element is a slanting/rising trend line that moves upwards, making the pattern to be bullish. The indispensable interpretation of the former is that the pattern reveals that each time sellers try to push price lower than projected; they are often less successful.

Since the ascending triangle is a bullish pattern, it requires close attention to the supporting ascension line because it shows that the bears are slowly exiting the market. The bulls are then able to push security prices past the resistance level, which is usually indicated by the flat top line of the triangle. Traders have to be cautious about entering the market before prices break above the resistance line. Because the pattern may fail to fully form or may be violated by a move to the downside/opposite direction. Although there is a lesser amount of risk mixed up with waiting for the confirming breakout, the bulls can still place reasonably stop-loss orders below the low of the triangle pattern.
Bearish ascending triangle
The bearish ascending triangle continuation pattern comprises up of three phases. The first phase is the background, which has to do with a robust spontaneous action with a rush in volume and price that establishes a clear picture of the controlling bearish trend direction. The second phase is gear towards a suspension for consolidation of the action both in volume and price that is usually represented by the ascending triangle. The third phase confirms a bearish continuation pattern if the action creates a new bearish breakdown with a flow from the bears in both volume and price.There are usually two methods of applying a bearish pattern, and both methods depend on trading style.
The methods indicate that the trend is on the trader\'s side, and the bears are maintaining a wall of resistance and a higher level of support evidenced by the slope of the ascending line. The aggressive trading technique can incredibly amplify the profit potential of an ascending triangle. The traders can employ the same pattern several times and profit from the ranging swing movements inside the pattern. Conservative traders, on the other hand, enter a trade once the lower ascending support line has a drop or the new breakdown is confirmed.
Ascending triangle stock
In the stock pattern, a price range between high and low prices represents the ascending triangle. The main distinguishing feature of ascending triangle formation in stock is that it generally has a horizontal trend line. This trend line is the resistance, which connects the highs at roughly the same level with an ascending trend line known as support that connects the higher and higher lows. To find the profit target of a stock using ascending triangle formation, obtain the high and the low of the ascending triangle formation and add that measurement to the breakout level. This method provides the perfect target for a continuation pattern. The ascending triangle stock formation is a very influential chart pattern that harnesses the supply and demand imbalances in the stock market.
Conclusion
The ascending triangle pattern can be said to be a double-edged sword that presents a higher risk and reward in the stock market. It is a pattern that gets narrower with time. The benefit of trading the ascending triangle chart pattern is that other traders get stopped out, they help "push""" the market further in your favor. However, one of the main problems the traders encounter while using an ascending triangle is the possible false breakout. The price may shift out of the pattern and fall back in line at a given point. Secondly, the price may break out on the other side of the pattern. As a result of those as mentioned above, the chartist mat has to draw the numerous times as the price action edges past the resistance level but fails to maintain the breakout price."


