How To Use Bollinger Bands

Nowadays there are many different indicators for trading in the Forex market. And it seems that every couple of months or so, a new trading indicator comes to the market. But often these new indicators are just a variation of the classic versions. Today, we will talk about one of the most robust trading indicators that has been proven to work for a long time. This is the Bollinger Bands indicator. We will discuss the basic elements of this indicator, and I will present some profitable trading strategies of the Bollinger Band.
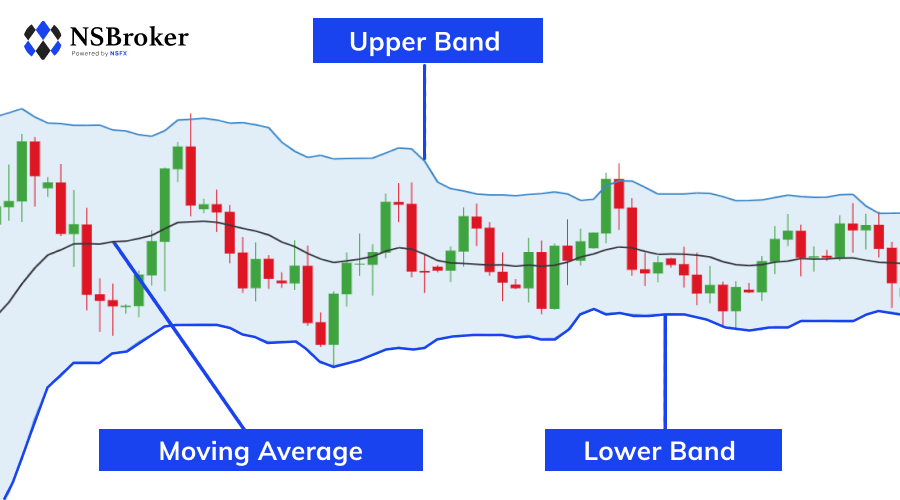
Although this is primarily a volatility indicator, the Bollinger Bands are very useful for discovering support and resistance areas. The indicator consists of three lines and each of these lines could have support/resistance functions, but the double Bollinger Bands, consisting of the upper and lower bands, are usually better than the middle line for this purpose.
There are a few signals that can be generated with the Bollinger Band. These signals respond to different price positions on the chart. Let's go through each of these signals and discuss their potential.

Bollinger Bands Squeeze
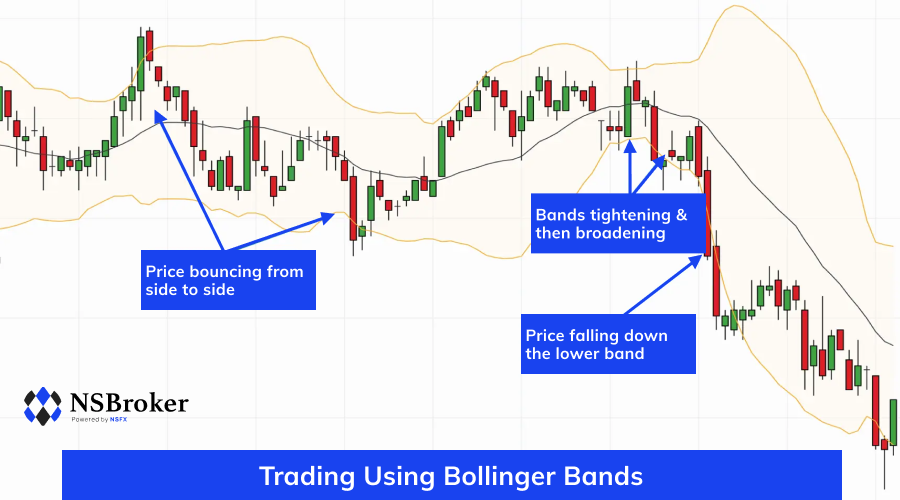
When the Bollinger Bands are close together, the trading indicator tells us that the volatility of the forex pair is relatively low. As such, trading volumes are typically low, and it is said that the pair is consolidating or moving apart rather than evolving. This is what we call a Bollinger Band Squeeze, as the bands are squeezed tightly together. In most cases, we should avoid trading in very tight price ranges, as they offer significantly less profitable opportunities than in trend phases.
The Bollinger Band Squeeze Breakout provides a good opportunity to enter the market when the price moves above one of the bands. This would provide support in favor of the end of the range bound market and the likelihood of the price entering a new trend phase.
The Price Touches The Lower Band
This is a standard Bollinger Band signal indicating that the price is relatively low/oversold from a volatility perspective. As a result, there may be a bullish rally that creates a long-term trading opportunity. Consider this as a hidden support level based on a measure of extreme volatility.
However, if instead the price falls quickly to the bottom and the gap between the two bands continues to widen, then we must be careful not to enter a long trade. If the bandwidths are expanding and we see strong price momentum below the lower band, this is an indication that a bearish trend should still be in play.
The Price Touches The Upper Band
The same scenario is in force, but in the opposite direction. We regard the upper band as a hidden resistance level based on extreme volatility measurement. However, if the bands widen and the price begins to close candle by candle above the upper band, then we expect further bullish expansion.
Bollinger Bands Moving Average Breakout
The breakout on the moving average of the Bollinger Bands is a confirmation signal, usually following a price interaction with the bands. When the price jumps from the upper band and then breaks the 20-period SMA in a downward direction, we get a strong price signal. If the price jumps from the lower band and then breaks the 20-period SMA in an upward direction, we get a strong long signal. This way the 20-period SMA breakout can be used to set exit points after entering a Bollinger Band trade.

The Bollinger Band chart above summarizes the signals we have discussed. The blue circles point out crucial breakouts through the 20-period Simple Moving Average. The black arrow points out a Bollinger Bands squeeze. The red arrow shows the price trending while breaking the lower Bollinger Band and the green arrow shows up trends on the upper Bollinger Band.


