Forex Weekly Forecast & FX Analysis July 29 - August 2

EUR/USD: Bearish
The intraday technical outlook is bearish for EUR/USD as the pair breached an important horizontal static resistance of 1.1187, and came back to it, renewing the bearish trade. As a result, another test of the 1.1100 support was noticed this past week, even though the bears failed to break through that level with the first attempt. Another noticeable level is 55-bars simple moving average, which acted as resistance during the last bullish whipsaw. As long as only a shadow left from that action, the bears prefer entering the market, using the sell-highs trading strategy. The range between the 21-bar exponential moving average and SMA55 curve could act as the resistance range in the upcoming week. Short positions from there should target 1.1100 support and 1.1076 as an extension of possible bearish slide. On the other hand, the bulls could keep fighting for the last defensive barrier on the road to 1.1000 round-figure threshold never seen in two years. Therefore, take-profit orders should be kept tight and the time in the market should be limited.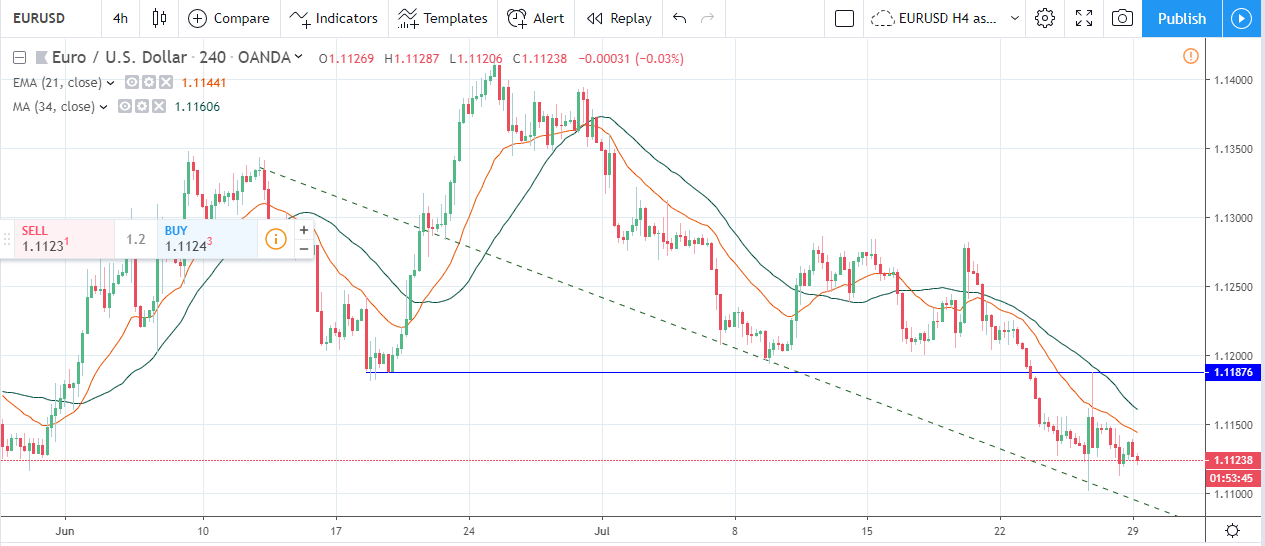
GBP/USD: Bearish.
The Sterling kept sliding down versus the greenback this past week, and GBP/USD even charted 26-months lows below 1.2400 support. However, there are several technical signs that the downtrend needs a healthy retracement in order to continue the southwards action on the medium-term perspective. Although the Bollinger Bands %B indicator had drawn a bearish breakthrough signal last Friday, the British Pound is vulnerable to a retracement as all of the intraday oscillators are extremely oversold. Williams %R is far below the negative territory, while Stochastic RSI oscillator is nearing the reversal signal once both lines will perform the crossover. On the other hand, opening long positions would be dangerous as such an approach would force traders standing against the long-term strong downtrend. Therefore, it would be reasonable to wait until the bounce-by-trend signal on larger timeframes and enter the market with fresh short positions later, at around 1.2550/2620. This summer’s target is still around 1.2000, and such a distance is worth waiting.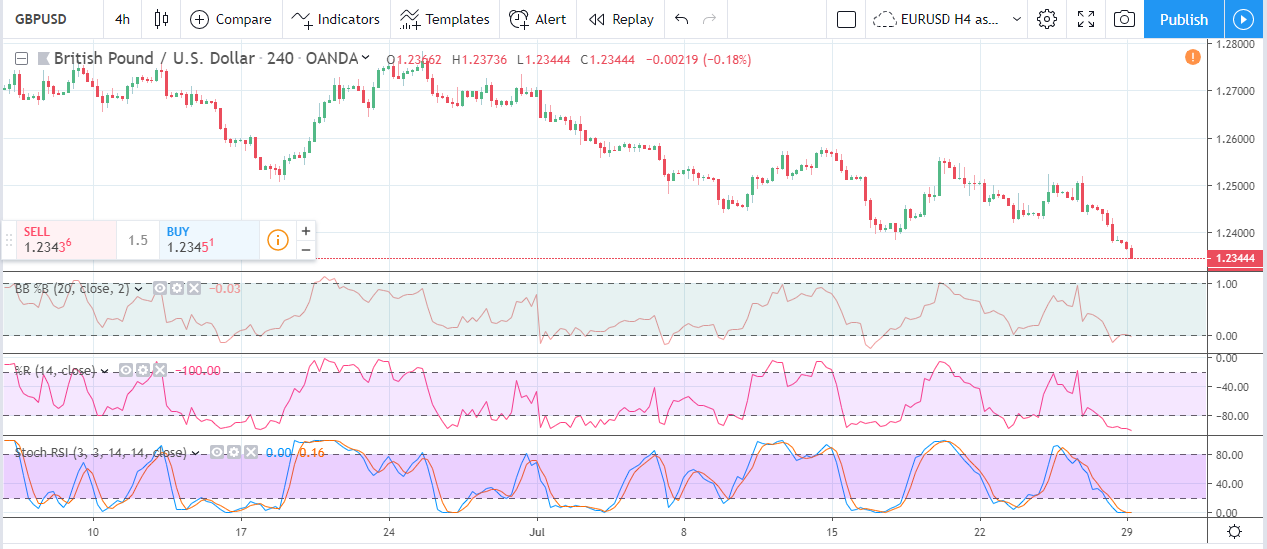
AUD/USD: Bearish
Aussie had finished the upside swing this past Monday as Parabolic SAR dots jumped above the price. The indicator stayed bearish throughout the whole trading week, pointing to a strong bearish sentiment. The ADX and DI indicator confirmed the previous assumption with a delay. The surplus between -DI and +DI lines turned negative, while the mainline remained below the threshold, pointing to a weak bullish momentum in play. As a result, AUD/USD dropped to the latest bottom below 0.6910, reflecting the strong selling pressure. If things continued in the same direction, the pair would slip to the previous low at 0.6832 in the nearest days. An alternative action would have a downside sharp swing with no significant effect in terms of four-hourly close rates. Once traders noticed a long downside shadow on intraday candlesticks, the buy-dips trading strategy would trigger postponed buy-orders, and AUD/USD could soar back to the recent top at 0.7080 and above. A longer-term outlook suggests more sideways consolidation bias rather than a bearish continuation. Therefore, traders should avoid holding short positions for too long, taking small but solid profits.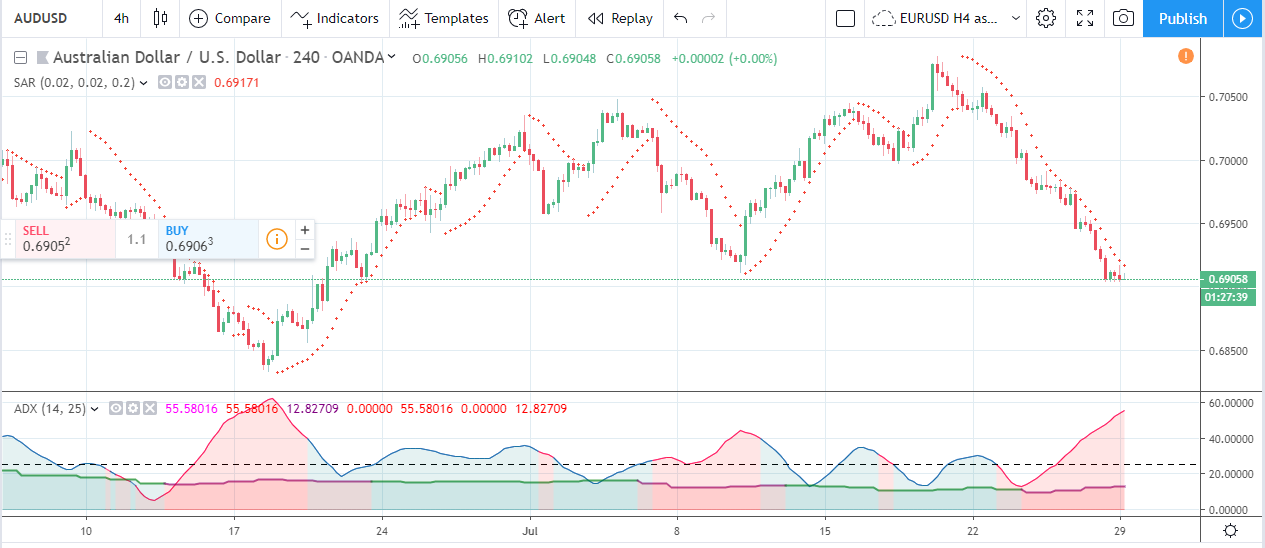
NZD/USD: Bearish.
The Kiwi had reached the local peak on July 19, and the bulls failed to proceed with the rally. The reversal action accelerated after NZD/USD breached Ichimoku’s Conversion Line support curve on Tuesday. The bearish retracement also deepened after Thursday’s close appeared below the Ichimoku’s Base Line. Even though the New Zealand dollar entered the Cloud and pointed to more uncertain conditions, the overall daily technical outlook is still bullish. The further price action will depend on how deep the daily close would be inside the span. A crucial technical support level is placed at 0.6606, and if the bears failed to breach it, the upside pressure would be renewed. The buy-dips strategy looks attractive as the sequence of higher lows and higher highs determine the current uptrend. However, deep whipsaws are still possible in the same way it happened on July 10 before the bearish retracement was over and the bullish rally began. Therefore, stop-loss orders for long positions should be deep enough to withstand possible fake breakouts.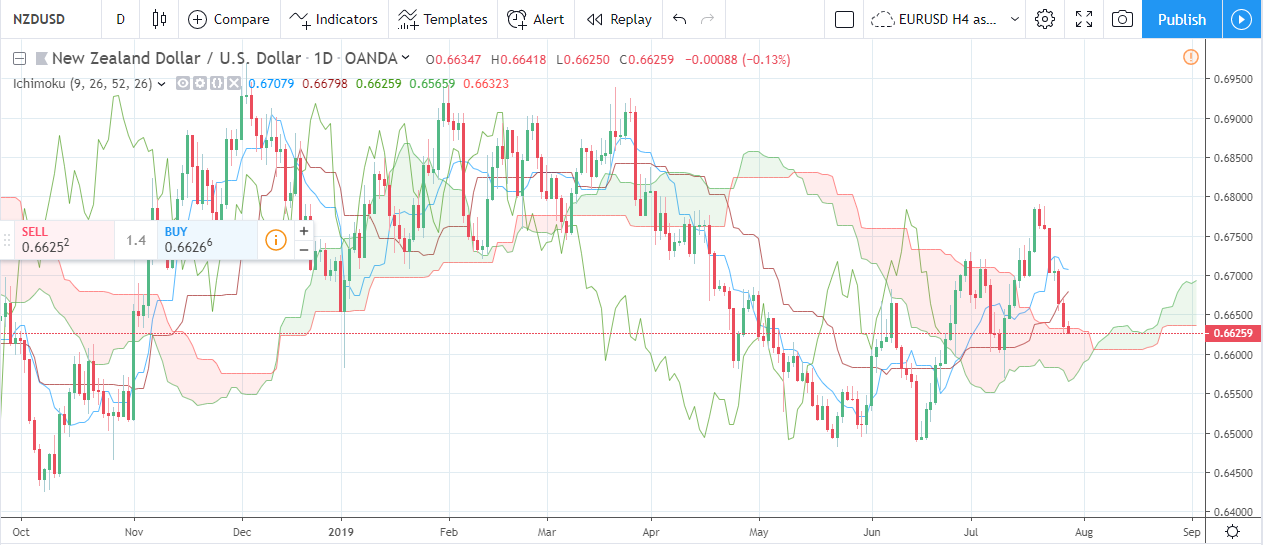
GOLD: Bullish
Although the price of gold retraced rather far from the latest peak of $1452, the upside risks remain as the overall technical outlook is positive on the daily timeframe. The Ichimoku Cloud indicator is still bullish as the span is positive and even enlarging the surplus. Daily close prices did not cross the Ichimoku Base Line support. And the sequence of higher lows is still in favour of the bulls. The yellow metal should renew the uptrend in the nearest days, and re-test the same high price level noticed on July 19. Last week’s depth of $1411 looks lucrative for medium-term long positions. On the other hand, if the bears took the gold market under total control, and pushed the gold price below the psychological support of $1400, then a deeper slide would appear on the table with targets at $1380 and $1360 in extension.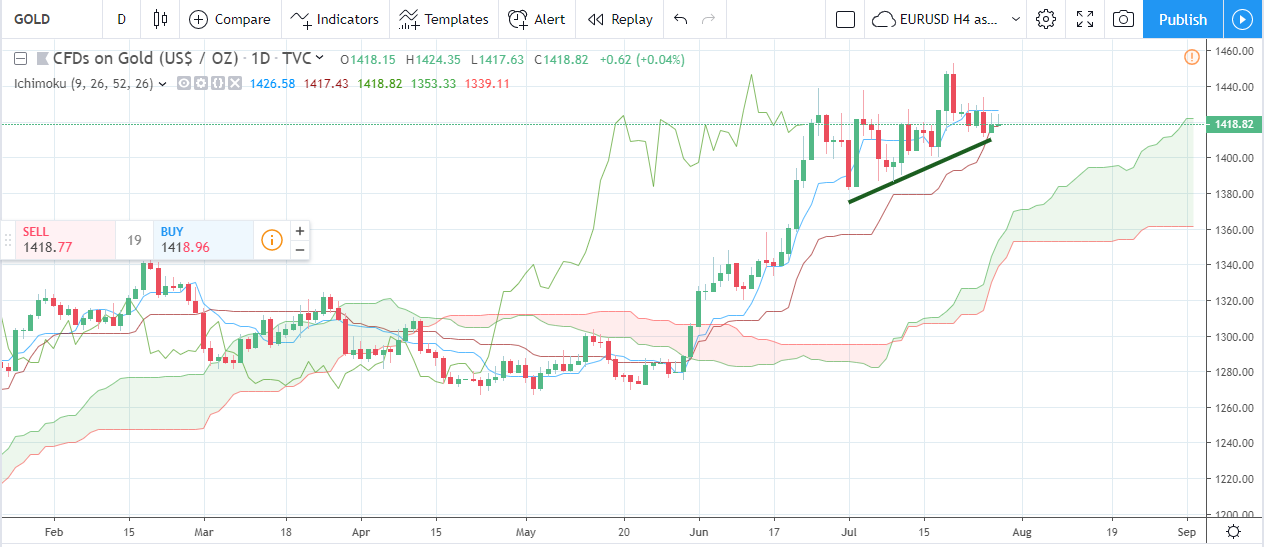
WTI Crude Oil: Bearish.
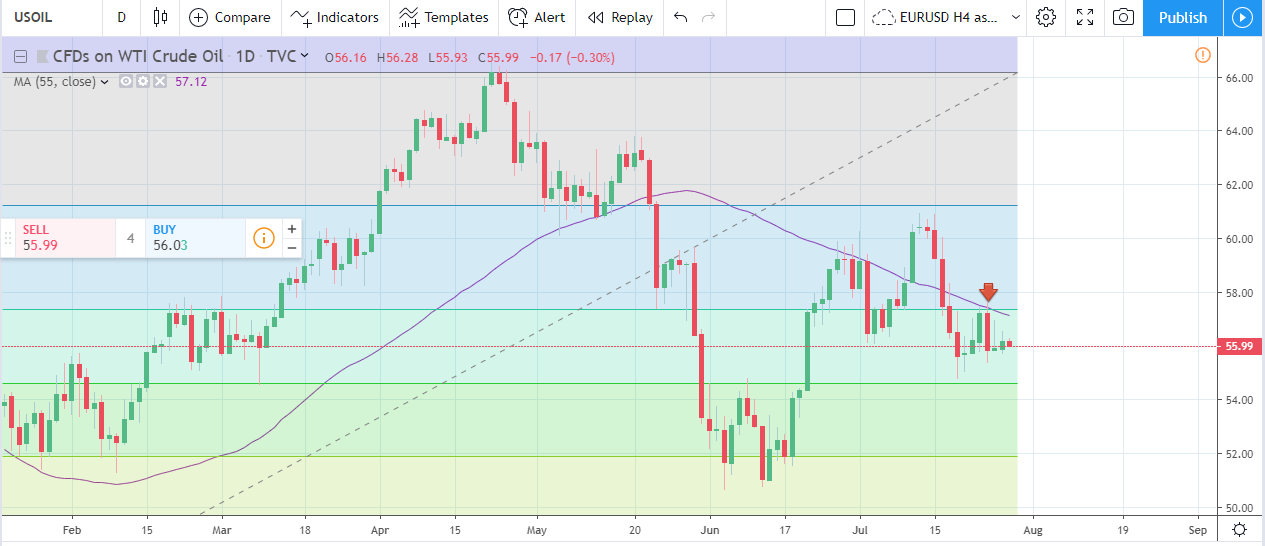
Last week’s bullish run was nothing by failed retracement attempt. The daily chart below clearly shows two significant technical resistance levels. The first one is the Fibonacci Retracement level of 61.8% from the uptrend started in December last year. The level is currently placed at $57.34 per barrel. The second resistance was the 55-days simple moving average, which currently comes at $57.13. On the other side, the support is far lower - $54.76 - the recent lowest weekly price. Those traders who missed the opportunity to open fresh short positions right after the failed bullish rally should consider waiting for intraday upside bounces before shorting the black gold this week. Targets are the same as above, and if the WTI Crude oil price breached the recent low, the market would eye $51.90 support level.