How to Trade Bull Flag Pattern

In today's technical Forex world, there are a lot of price action formations traders employ as a deciding factor for their next moves. One handy example is the bull flag pattern. This article will teach you how to identify and trade the bull flag pattern like a seasoned trader.
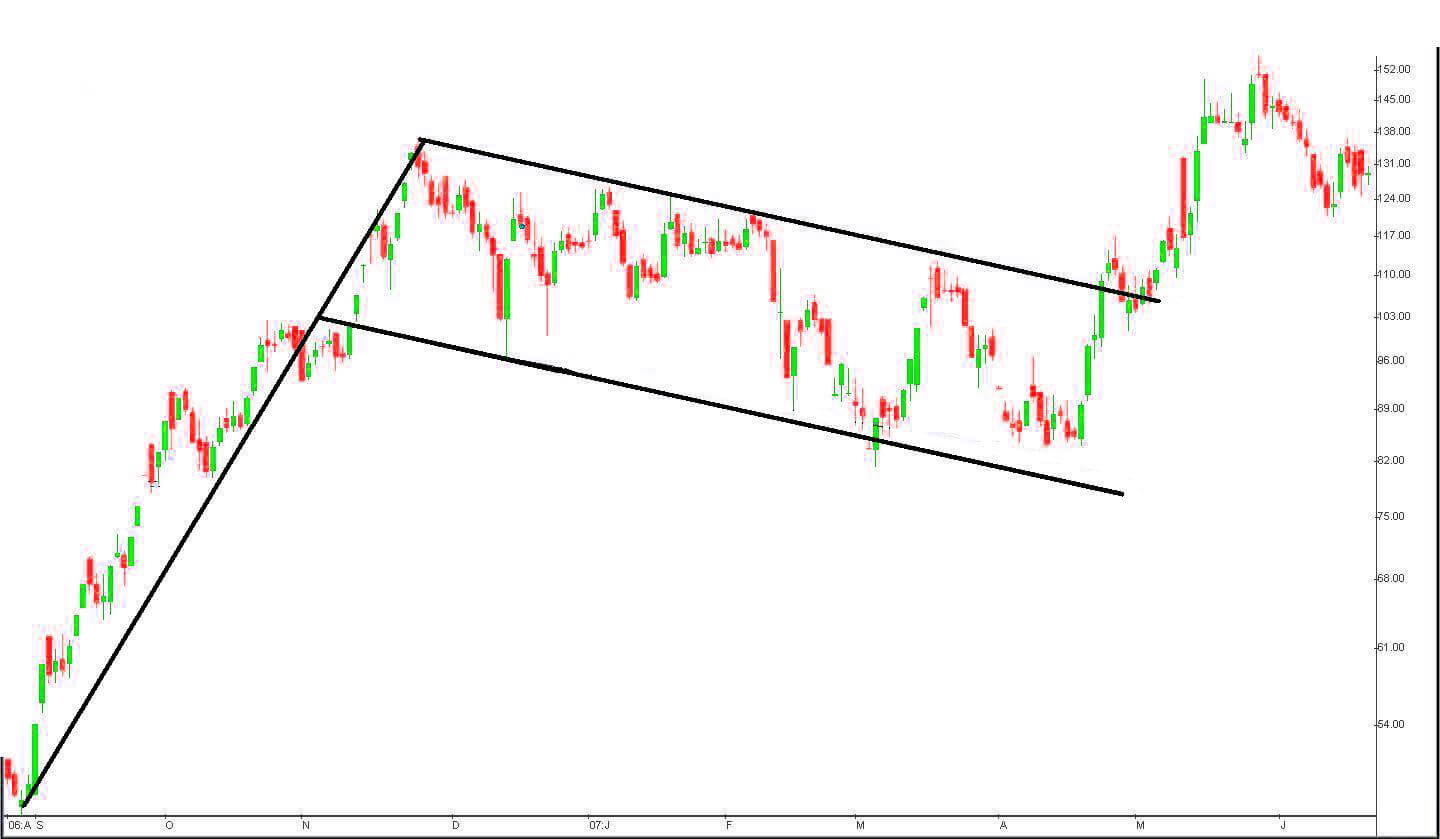
A bull flag is a continuation pattern that indicates a probable high surge in market volume. The pattern occurs as a brief pause in the trend that follows a strong price uptrend. A bull flag chart pattern resembles a descending sloppy channel and rectangle that is denoted by double parallel trend lines against the pre-existing trend. During the period of consolidation, the volume dries up through its formation and prepares to shove higher on the breakout. The actual price formation of bull flags looks like that of a flag on a pole. The uptrend that comes with it is why it is a bullish flag.
Bull flag trading
Bull flag trading strategy is relatively simple, but the flags are sometimes tricky to spot. Here are few things to look out for when trading the bull flag.
- When trading the bull flag, entry and exit points are very important. A rush-in could spell danger as the volume may fail to accumulate. Likewise, a delay may reduce your chances of earning big.
- The flag is easily spotted when using the candlestick chart, as the flag portion pans out clearer than when using a line chart. As mentioned earlier, the strategy is simple; the difficulty is picking out the formation. The pattern may occur as a bullish pennant, horizontal rectangle flags, and a horizontal rectangle angled down away.
- If you failed to enter the trade at an initial entry point, rest easy. The bull flag is a continuous pattern that repeats itself. Take note of the support, resistance, activities within the flag, and price actions. The end game here is waiting to confirm a possible breakout, i.e., when the stocks overcome the resistance. This point should serve as your next entry point.
- Just as it is with every trading strategy, the value of a stop-loss is immeasurable. The bull flag is not an exception; stop-loss is an integral part of the plan. You'd want to set your stop-loss at a point where the price of stocks trend below the breakout point. The move is a smart one as there is a high probability the stock price won't accumulate any time soon.

Bull flag patterns provide a statistical edge if correctly traded, but in the event of failure due to the setup, one needs to know where to go overboard. To explain it more explicitly, when traders get to the point on the chart where they know that the setup is no longer active, that becomes the signal to abandon the trade. There are different ways to manage the bull flag trade. The most prominent of all is to place a stop below the consolidation area. When you draw the line out on the bottom of the flag pattern, it indicates the point where one is aware that the trade setup is no longer working out, as well as prove that it's time to take a loss and move on. Another efficient method of managing bull flag trade is to employ the use of 20 days moving average as a stop. Consequently, when prices drop below that moving average, then you would close out your position.
Bull flag breakout
A breakout forms when the resistance trend line breaks as the prices flow back towards the highs of the formation and explode through, thereby triggering another breakout and uptrend move. Experts believe that the sharper the spike on the flag pole, the more potent the bullish flag becomes. A flag comprises up of an explosive, strong price move that forms the flag pole, which is followed by an arranged and transversely symmetrical pullback that forms the flag. Whenever the trend line resistance on the flag breaks, the next leg of the trend moves is activated. The flag is separated from a typical breakout or breakdown by the pole formation, which represents a vertical and parabolic initial price move.
Bullish flag breakout formations are usually present in stocks that exhibit strong uptrend. The structure is often referred to as bull flags judging from a resemblance to a flag on a pole. The pole, on the other hand, is the result of a vertical increase in stock and the flag results obtain from a period of consolidation. Occasionally, despite a robust vertical rally, the stock might refuse to drop appreciably, as bulls snap up any shares they can acquire. Any breakout from a flag often results in a strong move higher, measuring to the length of the prior flag pole. It is worthy of mentioning that these formations also work the same way in reverse scenarios, which is known as bear flags and pennants.


